
Five Things You Should Know Before Reading:
-
This is not new silicon; it’s a better-binned 9800X3D with a bigger boost number.
-
The X3D design means there is an L3 cache extension. AMD is world leading in shipping products with hybrid bonding integration.
-
Gaming wins are real in mid range, but taper when GPU loaded.
-
AI performance is still hard to judge, with GPU vs NPU a hot debate. The problem with AI is still the hardware fragmentation.
-
The 9850X3D is slightly faster, but it comes at a cost.
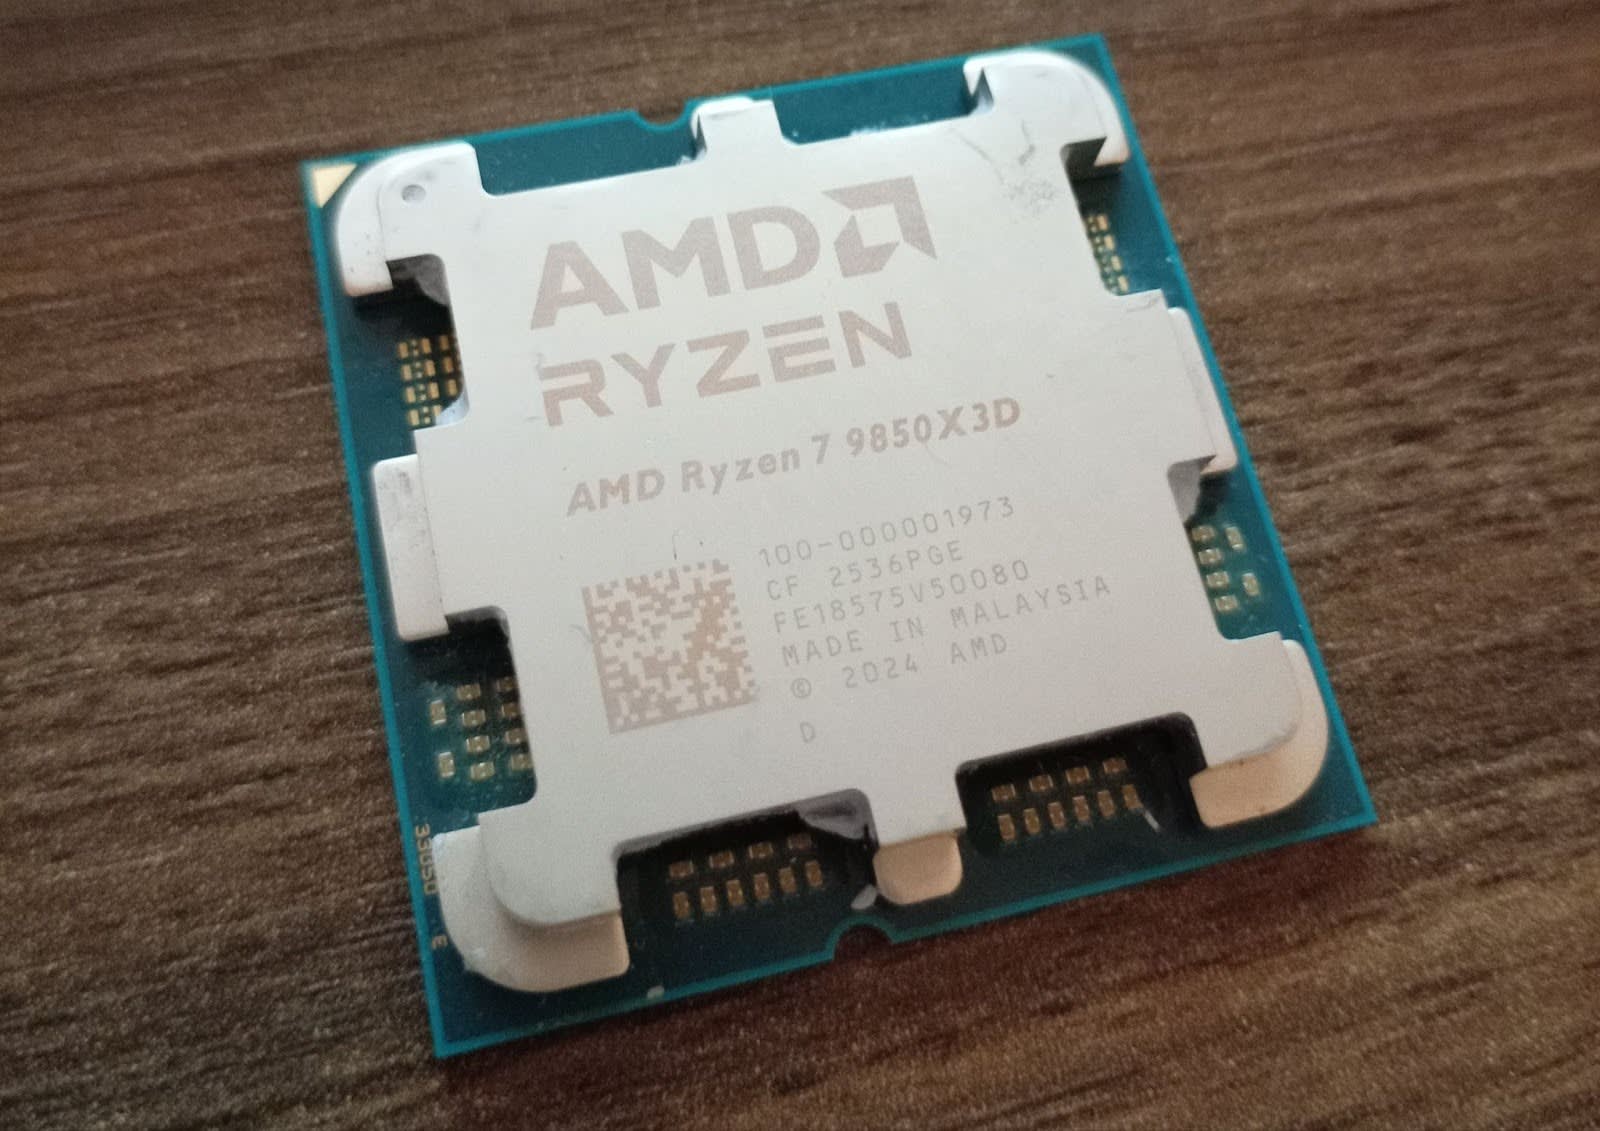
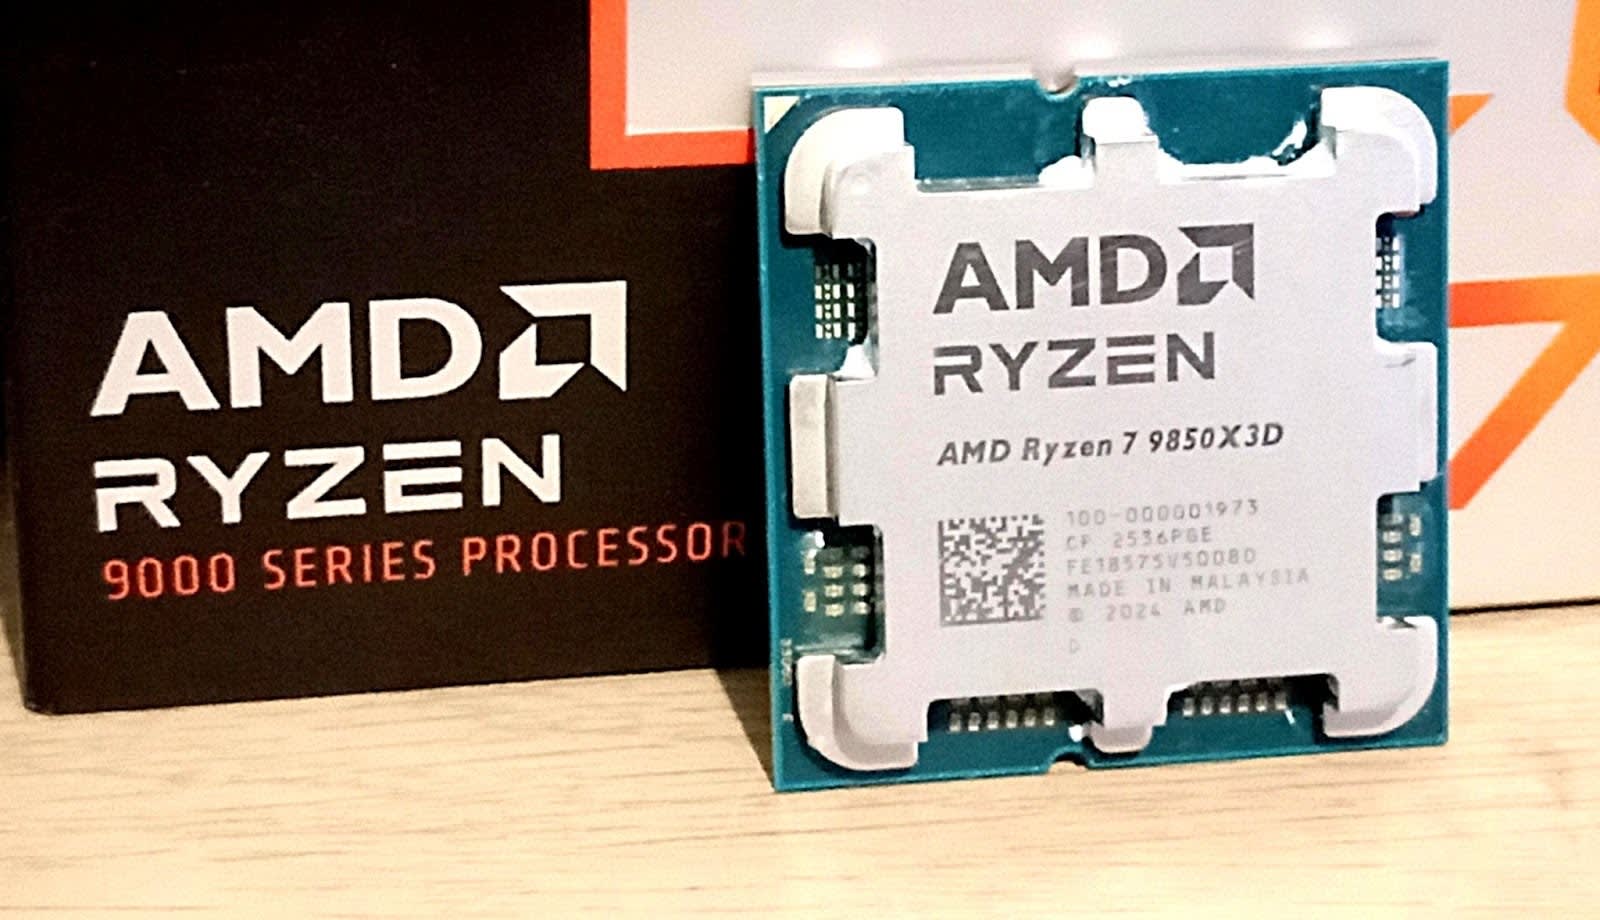
Back at CES 2026, AMD announced just one new desktop chip on its AM5 platform for consumers to feast on. Almost everything at that show was seemingly focused on AI, and while AMD refreshed its mobile portfolio, the gamers were asking about graphics and desktop. Insert the new AMD Ryzen 7 9850X3D.
On paper, it is a Ryzen 7 9800X3D with boosted frequencies – an 8-core chip with extra cache that boosts to 5.6 GHz. Those clock speeds are impressive for an X3D part, and mirror previous mid-cycle refreshes, but the expectation is that the faster frequency will bring improvements to gaming performance. X3D chips have been heralded as the new standard for leading edge gamers, and this one is designed to be one of the best.
The TL;DR is that the wins the X3D has are too easy to misunderstand. Everyone treats 3D V-Cache as a universal upgrade path, regardless of purpose. What’s not to love about having extra memory and saving a few trips out to the now expensive DRAM market?
As you’ll see in our testing, the charts look great in CPU-bound games. The X3D brings significant benefits to gaming performance in CPU-bound scenarios, where a larger L3 cache delivers a significant boost in titles that leverage it.
But it struggles to bring the same value-add to other areas. This is the eternal dichotomy of upgrading one degree of freedom with specific benefits. Really good in one spot, same-same in others.
Honestly, that’s what this review is really about – not whether the 9850X3D tops another set of cherry-picked game charts, but whether the combination of higher binned silicon with higher clocks and stacked cache produces a faster and better-behaved CPU across the board. There are scenarios in here where X3D excels above the competition, but there are areas where adding large pools of L3 cache doesn’t move the needle, and that has to be considered when buying into AMD’s X3D platform.
This isn’t really about focusing on a victory for AMD and 3D V-Cache, but more about whether it can dominate more than just one specific corner of the benchmark universe. Games that are CPU-limited and cache hungry? Sure, it’ll really hit the mark. But in everything else, it has to show that it can deliver in these areas, too. To get there, I’ve treated the 9850X3D like a desktop CPU first and a gaming chip second.
On paper, AMD presents a familiar recipe, and that’s kind of the point. The Ryzen 7 9850X3D is still an 8-core X3D gaming workhorse for AM5, built around Zen 5. It’s a good chip in isolation, and great that AMD is leaning into higher frequencies without changing the fundamentals. But the measure is in what the tradeoff is for the extra 10% in cost.
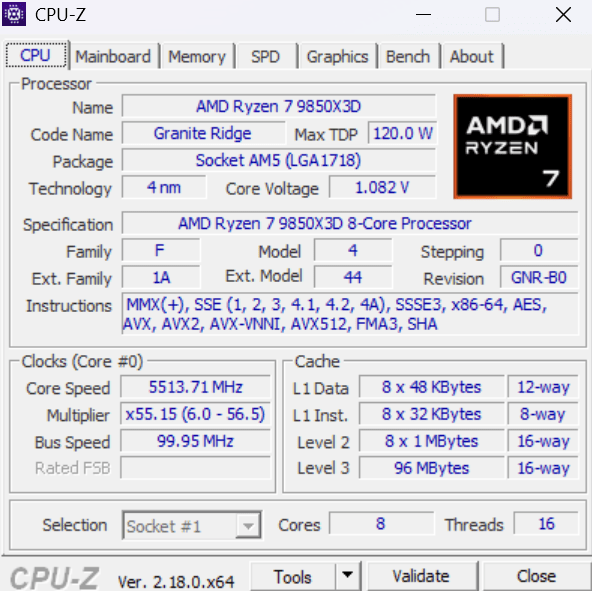
Ryzen 7 9850X3D Specifications
-
Architecture: Zen 5
-
Codename/platform: Granite Ridge (AM5)
-
Cores/threads: 8 / 16
-
Base clock: 4.7 GHz
-
Boost clock: 5.6 GHz
-
L1 cache: 640 KB (private)
-
L2 cache: 8 MB (shared)
-
L3 cache: 96 MB (shared)
-
Default TDP: 120W
-
Memory: 128-bit, up to DDR5-5600, up to 256 GB, UDIMM only
-
PCIe: PCIe 5.0
-
PCIe lanes (total/usable): 28 / 24
-
Supported Motherboards: A620, X670E, X670, B650E, B650, X870E, X870, B840, B850
-
Integrated Graphics: RDNA 3.5, 2 Compute Units, 2.2 GHz
-
Launch Date: 29-Jan-2026
The headline for AMD is a 5.6 GHz boost frequency, a +400 MHz bump over the Ryzen 7 9800X3D, while keeping the rest of the package broadly intact. This isn’t a small change for an X3D part either, because historically, X3D parts have traded off high frequencies for better cache behaviour in cache-sensitive tasks such as gaming.
For those unfamiliar with the concept of large caches like X3D, it doesn’t make a core run faster in frequency. The concept is that it causes the core wait less often because more data is a shorter time away. The win here comes from avoiding DRAM trips when a game’s workset spills beyond the current cache. These benefits tend to show up in low and overall tighter framerates. In workloads that are compute-bound, additional L3 cache doesn’t really add anything to the mix.
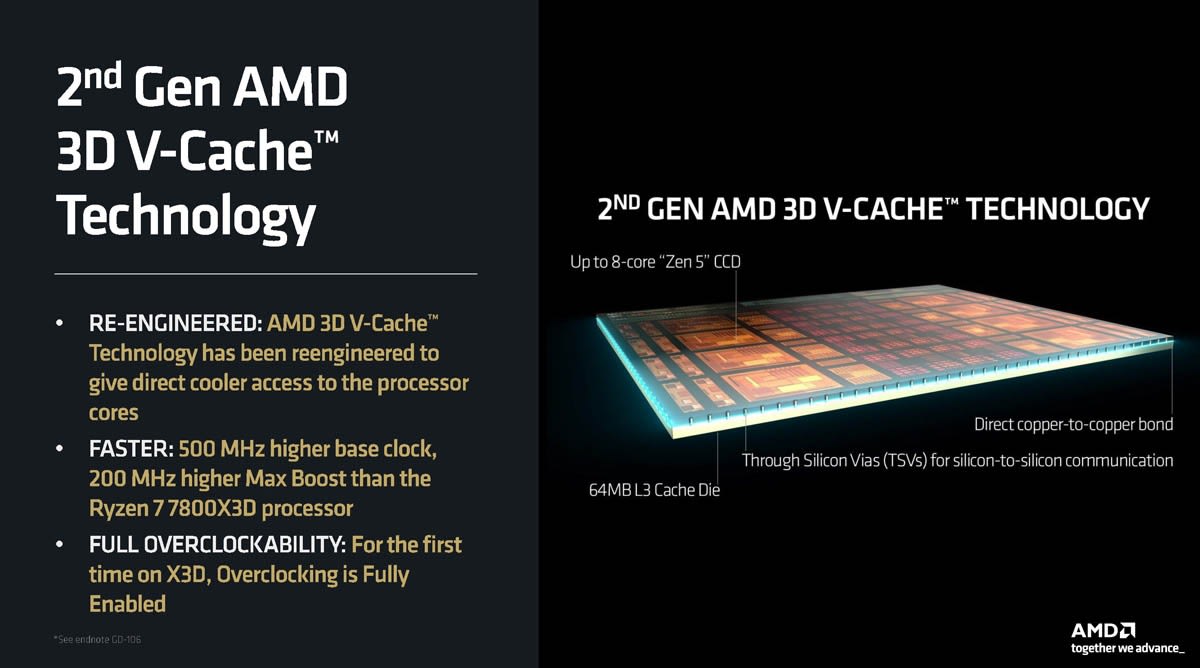
X3D is a physical technology – it’s a design crafted by packaging an extra slab of SRAM onto the compute chip, so a workset has more room to stretch before it trickles over into the DRAM. Compared to previous generation AMD X3D designs, such as the Ryzen 7 5800X3D, AMD has flipped the order of the two chips in the package, placing the cache on the underside of the compute die. This means the hot cores are at the top, and can dump heat into the heatspreader or IHS more effectively. That’s pretty much the real reason AMD can effectively bump up clock speeds without changing the fundamentals of X3D and its packaging. It does have added complexity though. You can find out more by watching our video here:
X3D also has a side benefit, especially in the current DRAM pricing environment: it makes memory speed matter less than it does on a non-X3D chip. When you have a much larger L3 pool right next to the cores, the CPU has fewer reasons to go to DRAM in the first place, so the usual obsession with the fastest and largest-capacity DDR5 kit is less important. AMD states DDR5-6000 is the sweet spot, slightly above its rated box speed.
Before we get to the benchmarks, here are our test benches for AMD and Intel. As we start ramping up our testing, this initial batch is limited based on access, but will improve over time.
AMD Test Bench
-
Zen 5 CPUs: Ryzen 9 9950X, Ryzen 7 9850X3D, Ryzen 7 9800X3D
-
Zen 4 CPUs, Ryzen 9 7950X, Ryzen 9 7700X
-
Motherboard: MSI X870E Gaming Carbon WIFI
-
Power supply: Corsair HX850W
-
CPU cooler: Noctua NH-D15 G2
-
Graphics card: Sapphire AMD RX 9070
-
Memory kit: G.SKILL 32 GB (2 x 16GB) Trident Z5 RGB DDR5-6000
-
Memory operating mode: Rated speed for each chip
-
Storage: Samsung 9100 Pro PCIe 5.0 SSD 1 TiB
-
Operating system: Windows 11 (25H2)
Intel Test Bench
-
CPUs: Core Ultra 9 285K, Core Ultra 5 245K
-
Motherboard: GIGABYTE Z890 Aorus Elite WIFI ICE
-
Power supply: Corsair HX850W
-
CPU cooler: Noctua NH-D15 G2
-
Graphics card: Sapphire AMD RX 9070
-
Memory kit: G.SKILL 32 GB (2 x 16GB) Trident Z5 RGB DDR5-6000
-
Memory speed used in testing: Rated speed for each chip
-
Storage: Samsung 9100 Pro PCIe 5.0 SSD
-
Operating system: Windows 11 (25H2)
As this is the start of a new testing suite, we are in the process of defining our hardware and workflow. Welcome to the first set of benchmarks!
Regarding benchmarks, we broadly split into four sections.
CPU Peak Power
The first is power consumption, and we use a simple peak power test. This will be something we’ll investigate better over time, ideally over multiple frequencies and voltages, but due to timing we only have peak power for now.
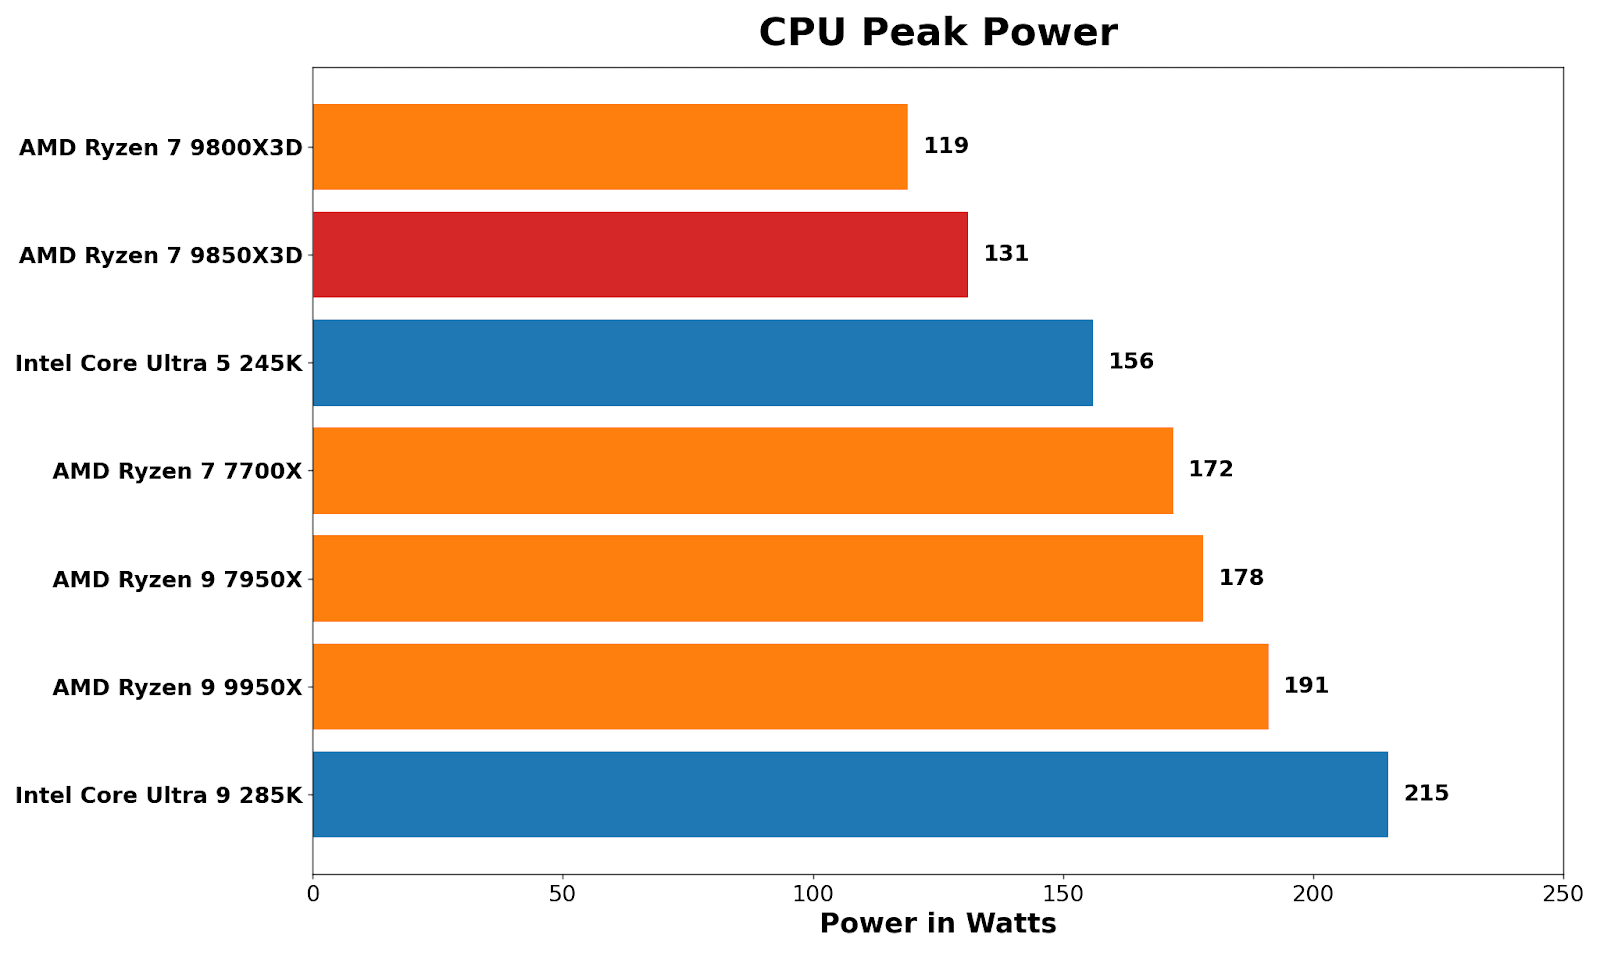
Starting out with the power consumption of the CPU. Because the X3D chips are often lower clocked than the non-X3D versions, this is often an area where efficiency comes into play. Typically, we see AMD chips performing in and around their respective TDPs, although with our chip it did pulls around 10% more power than the 9800X3D, both rated at 120W TDPs. One would surmise that the extra boost to the core boost speed means it consumes around 12 W more power at peak; it’s whether this additional power and frequency bump translates to performance across the board.
Machine Learning
Next is AI testing, for which we bring in MLPerf Client, which is quickly becoming a very useful tool to judge consumer-grade machine learning tasks. A big thank you to our compatriots over on the team there, including Scott Wasson and friends, for making the client version so easy to use and applicable.
The two main metrics for machine learning is TTFT (Time to First Token), ie how quickly the model responds, and TPS (Tokens Per Second), how fast it does respond after that initial hump.
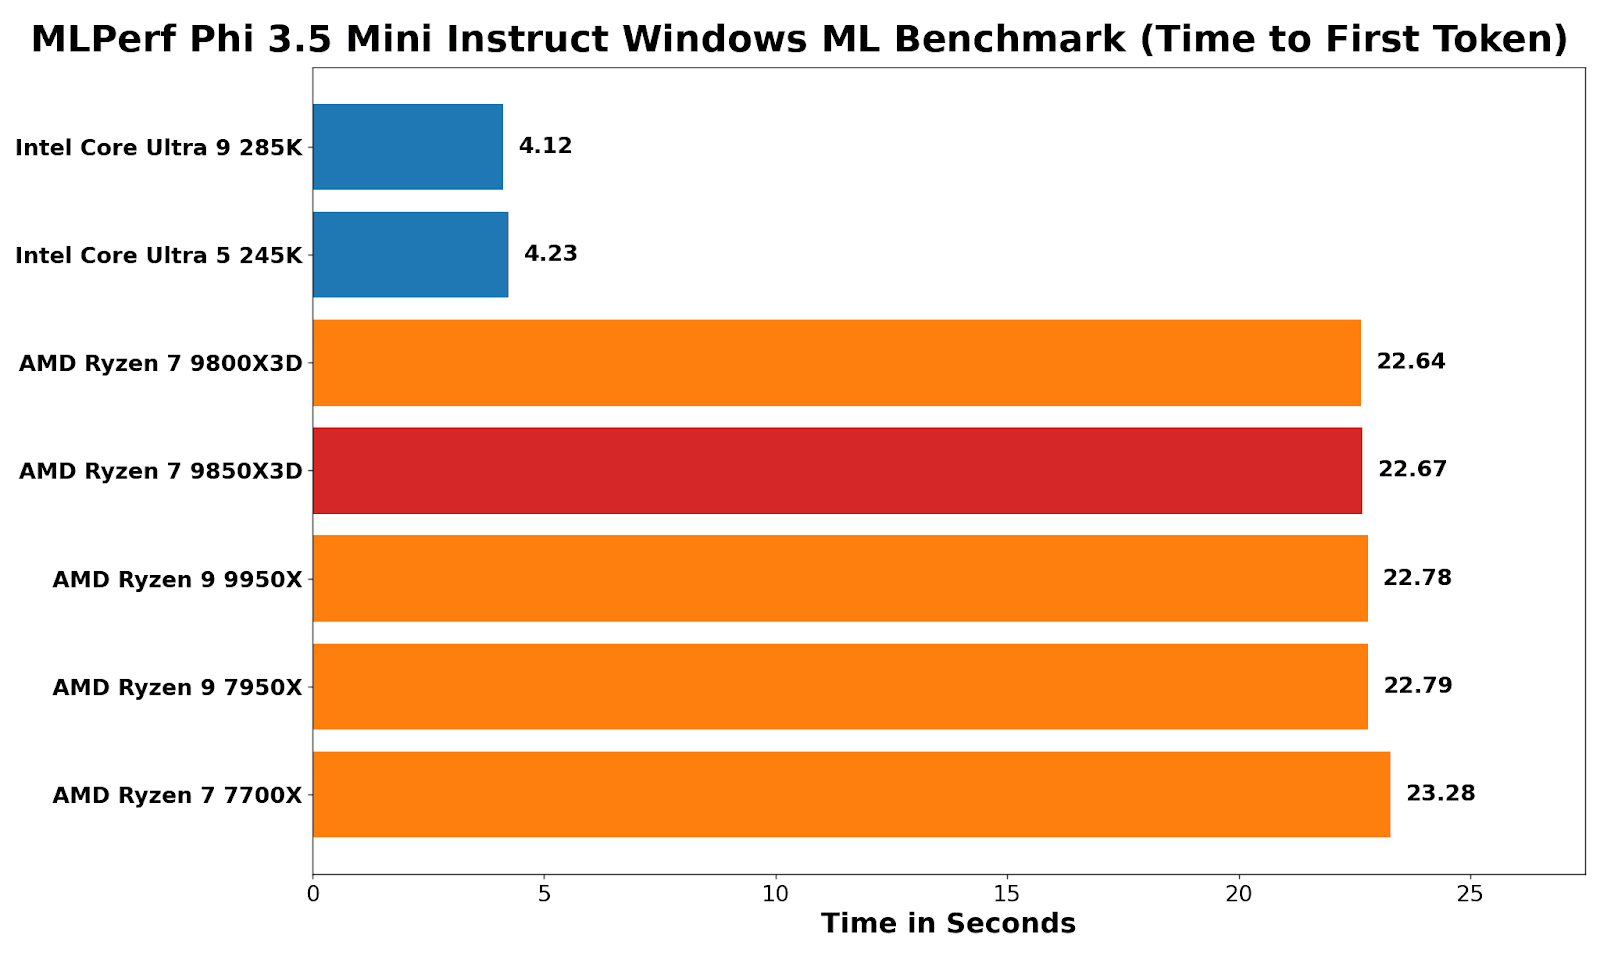
Looking at MLPerf and using the Phi 3.5 Windows ML benchmark, the clear benefit of Intel’s NPU in the Core Ultra (Arrow Lake) series of processors is evident: time to first token is around 5.4x faster than on every AMD chip tested. This is because the NPU can be used here – AMD only has the integrated graphics.
On AM5 desktop parts, that “Radeon Graphics” block is essentially a display-first iGPU: two RDNA compute units (128 shaders/stream processors) intended for desktop output and media, not heavy GPU compute, so there’s parity across the Ryzen CPUs here, but not parity versus an NPU-accelerated path.
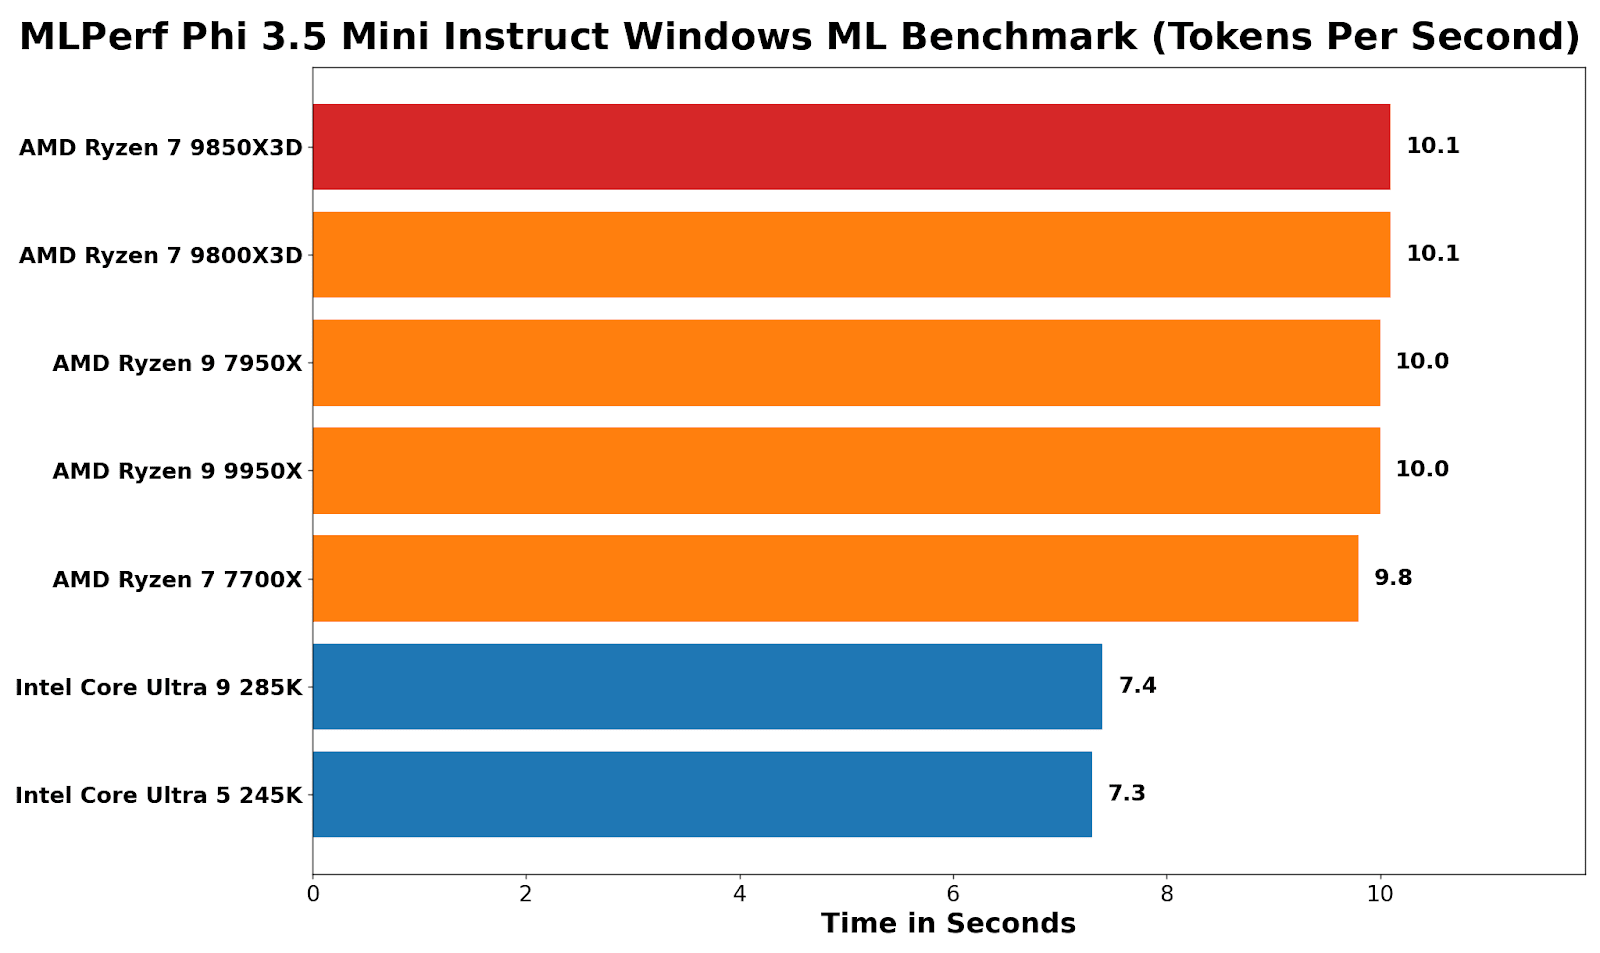
Analyzing tokens-per-second performance, the narrative is flipped. Intel wins the time-to-first-token hard, but once generation is underway, AMD chips run around 25-30% faster than Intel chips.
A key point here with the Ryzen 9 9850X3D (and 9800X3D) is that the addition of 3D V-Cache (64+32=96MB) doesn’t provide any performance benefits for AI workloads, because the optimized path is through the graphics. Even the Zen 4-based Ryzen 7700X is a whisker behind the Zen 5 cores here, showing that Windows ML does not benefit from the uplifts associated with core architecture.
In future with this test we also will be aiming to report power for a performance/token metric.
CPU Performance
The CPU core testing combines a few common tests that a lot of reviewers use, such as Cinebench 2026, Geekbench 6, and Blender 4.5. We are in the process of integrating SPEC2017 into our workflow, but were unable to arrange it in time. Expect to see it in future reviews.
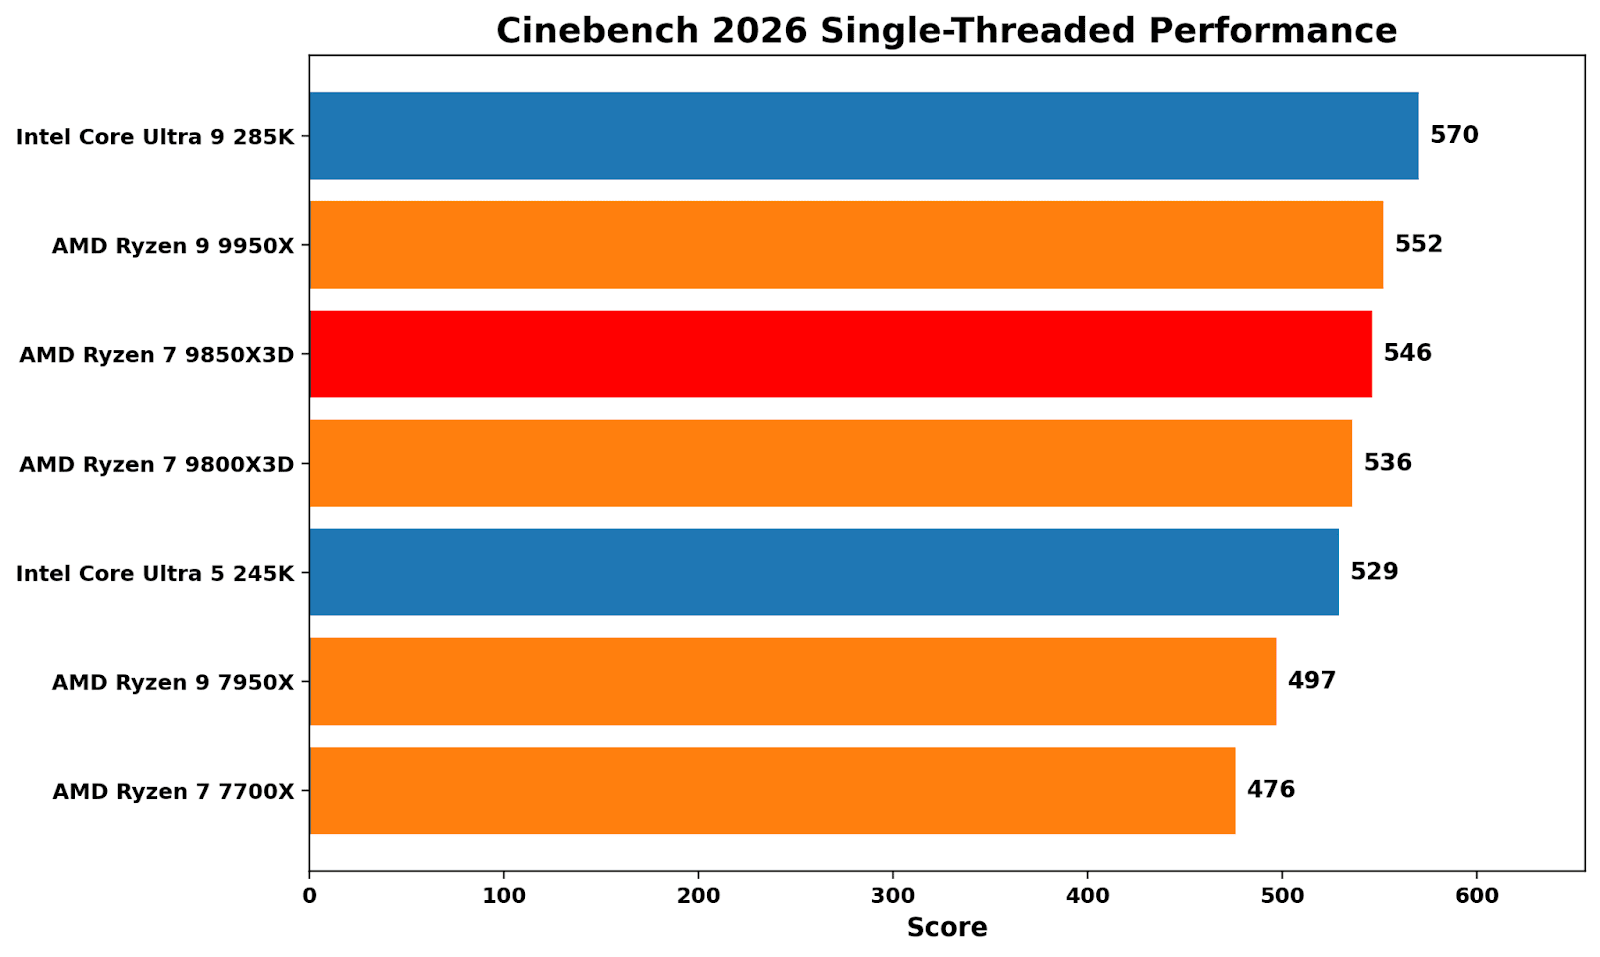
Cinebench 2026 single-threaded is still a clock and front-end-heavy contest, and currently Intel’s 285K sits around 3% ahead of the Ryzen 9 9950X. In terms of the Ryzen 7 9850X3D, it’s around 4% slower than the 285K, while the increase on boost with speeds of up to 5.6 GHz offers around 2% additional single-threaded performance than the Ryzen 7 9800X3D.
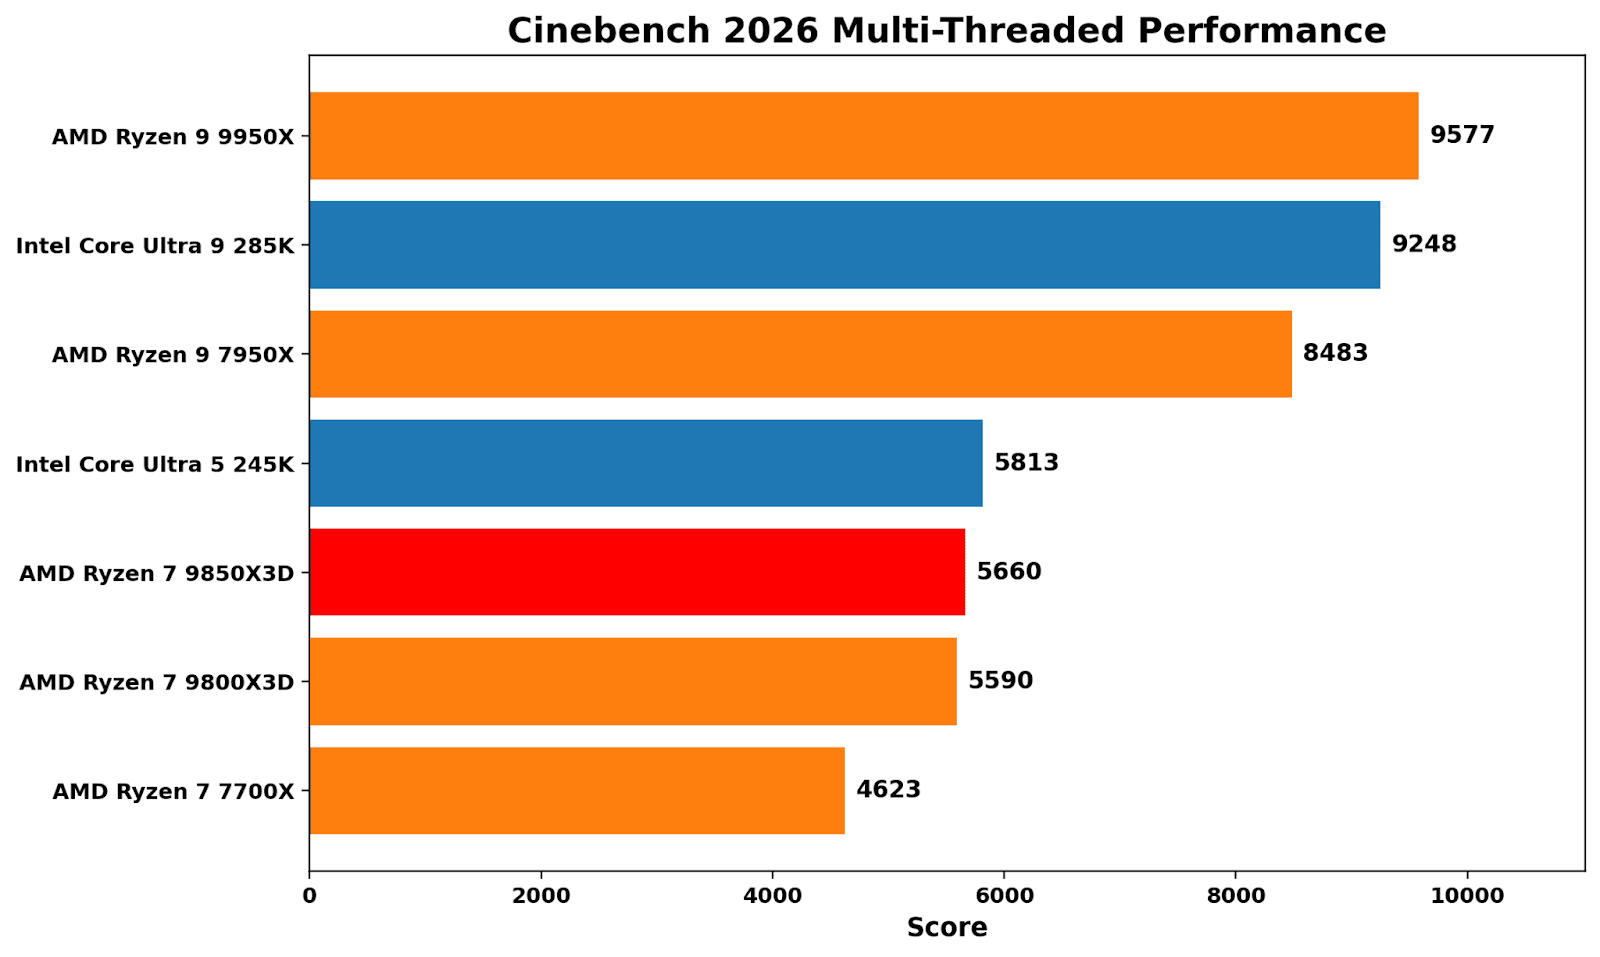
Transitioning to Cinebench 2026’s multi-threaded benchmark, it’s mainly a test about core count and bigger cores. AMD’s Zen 5-based 9950X (16C/32T) proves more effective than the competition, with the Intel Core 285K slightly behind (8P+16E). For the Ryzen 7 9850X3D, the performance gains are marginal, with a boost in boost frequency yielding just over 1% additional performance. It’s a reminder that stacking L3 cache isn’t really beneficial for compute-heavy tasks and workloads.
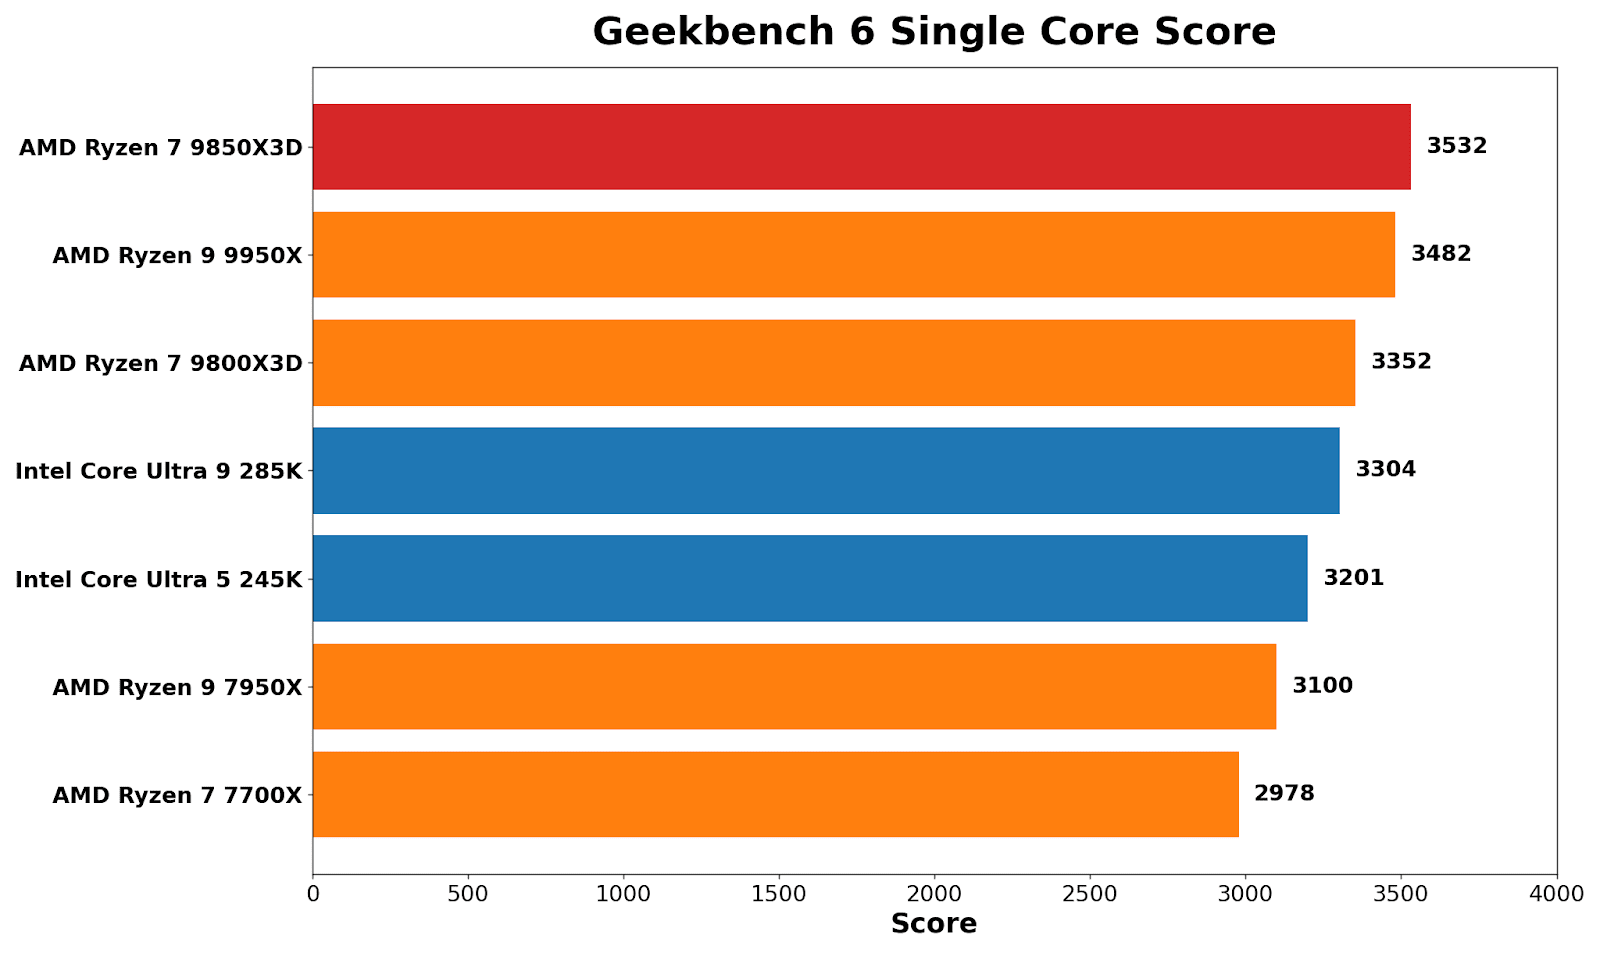
In Geekbench 6’s single-core benchmark, the Ryzen 7 9850X3D tops the list, even edging out the 9950X by around 1.4%. It also shows an uplift of around 5% here over the Ryzen 7 9800X3D. It’s prevalent because Geekbench tends to reward short, turbo-heavy boosts rather than consistent, sustained throughput.
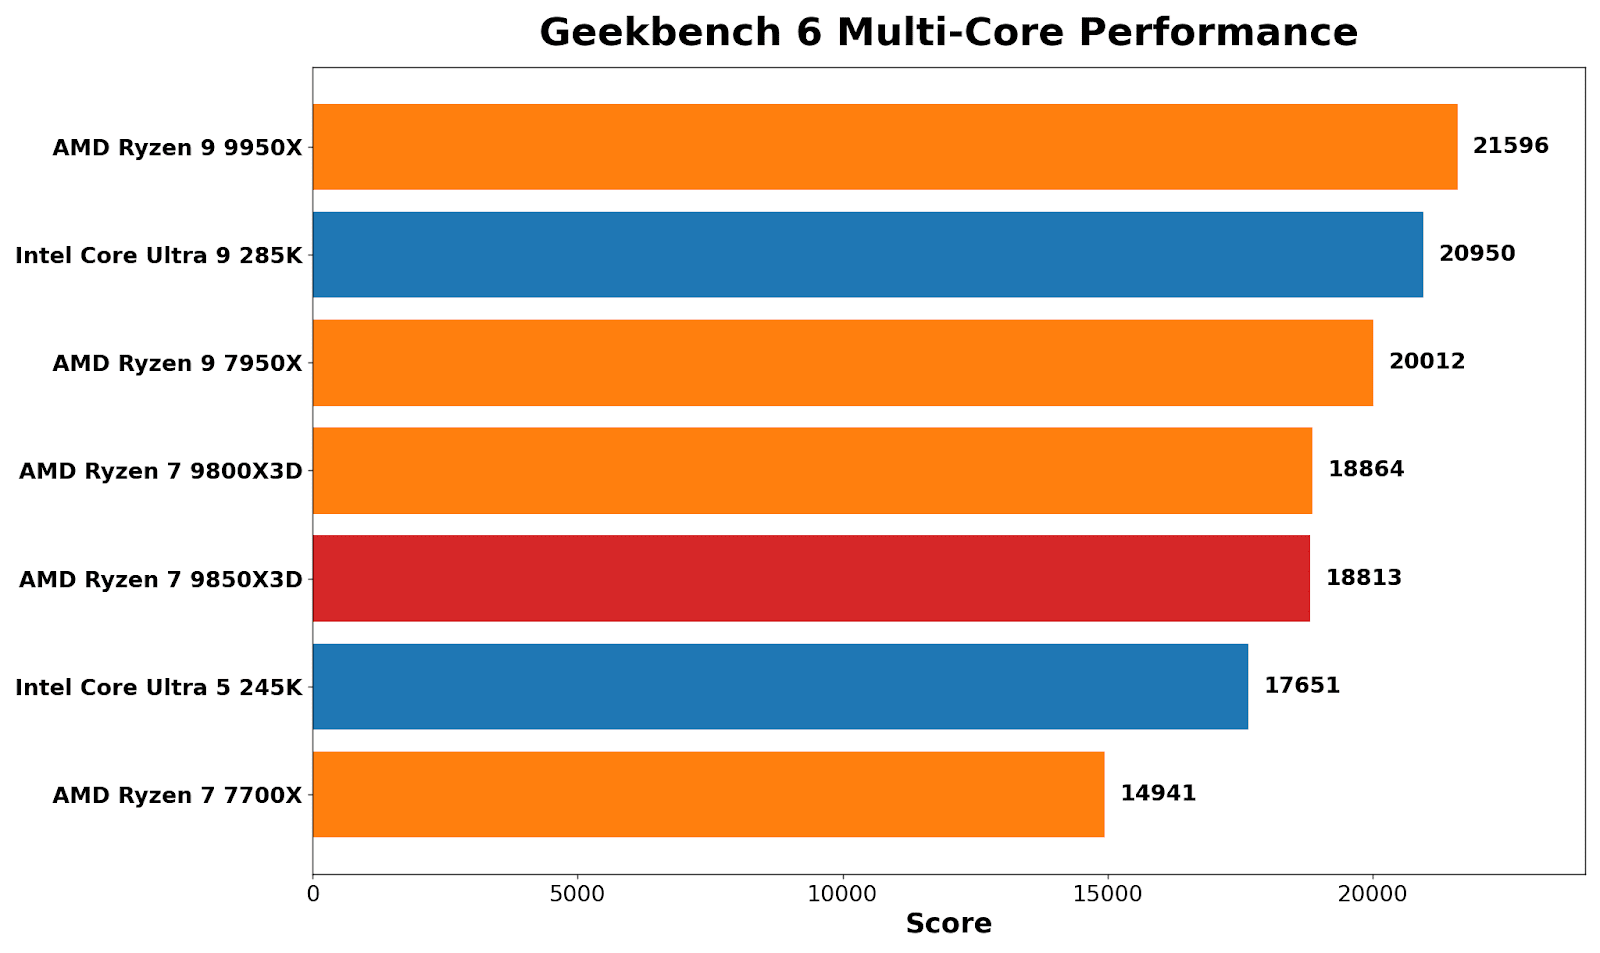
Geekbench multi-core brings things back to the expected hierarchy of multi-threaded performance: AMD’s Ryzen 9 9950X wins out, Intel’s Core Ultra 9 285K comes in second by around 3%, but the real takeaway here is that the Ryzen 7 X3D pairing (9850/9800X3D) is effectively tied. There’s a noticeable uplift over the Zen 4 8C/16T 7700X, which is expected given the generational gains from Zen 4 to Zen 5.
Blender 4.5 is more about pure throughput than anything else, and it treats the X3D chips in an unbiased fashion; performance between the 9850X3D and 9800X3D is virtually identical. It’s another way of saying that stacking L3 cache doesn’t help in pure grunt and rendering throughput.
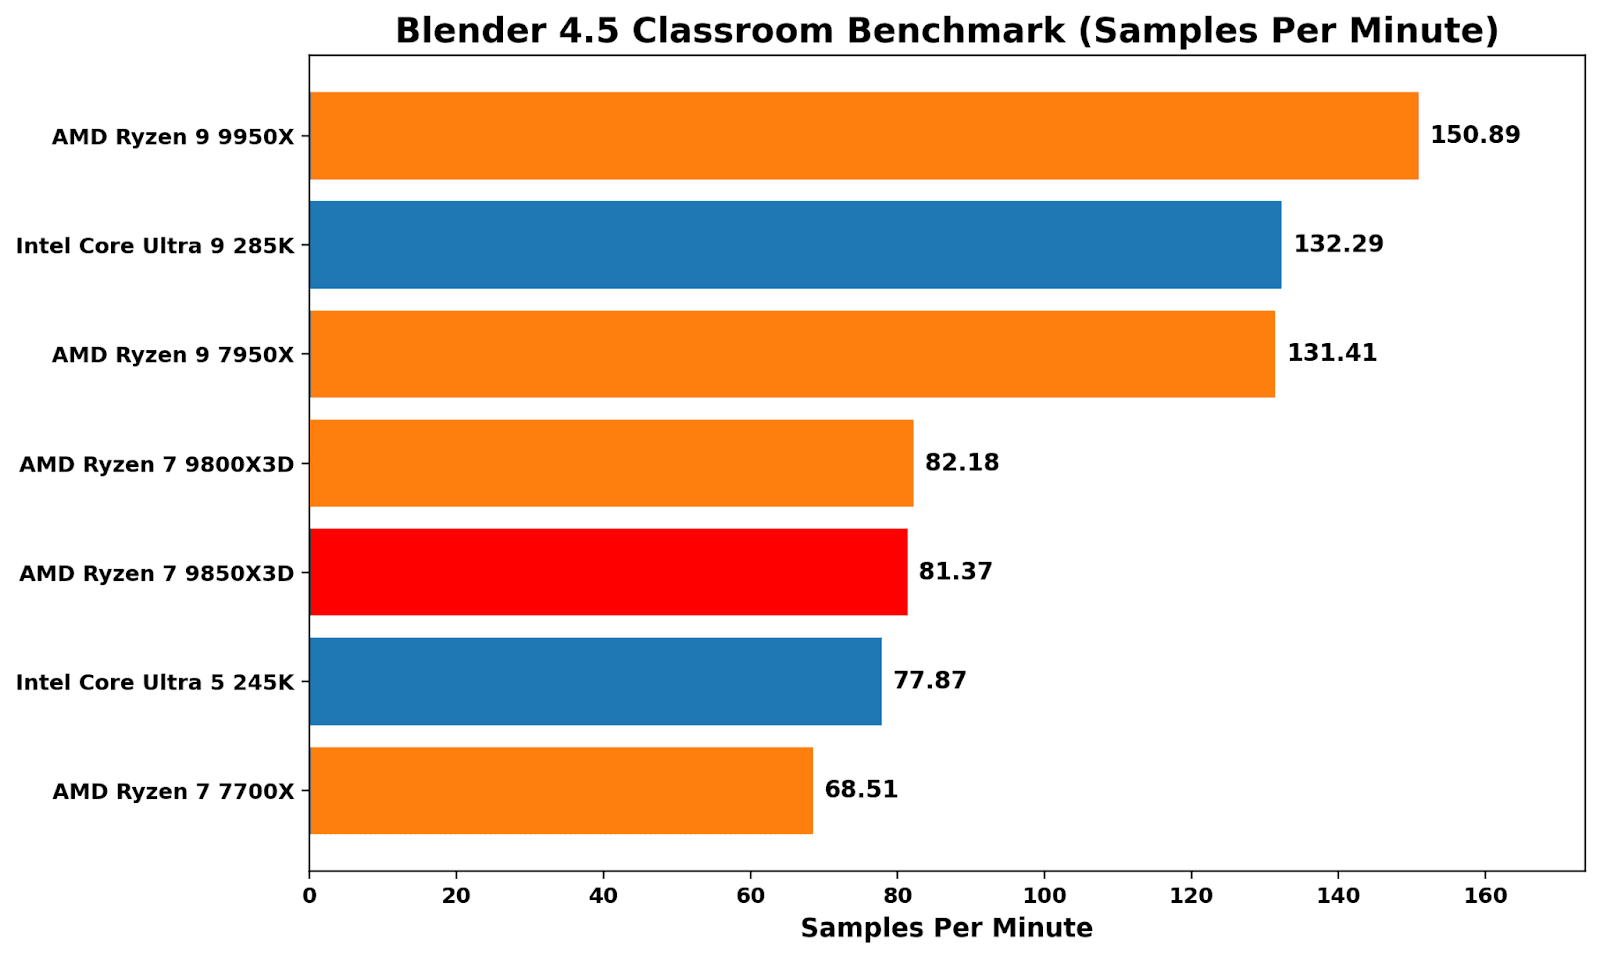
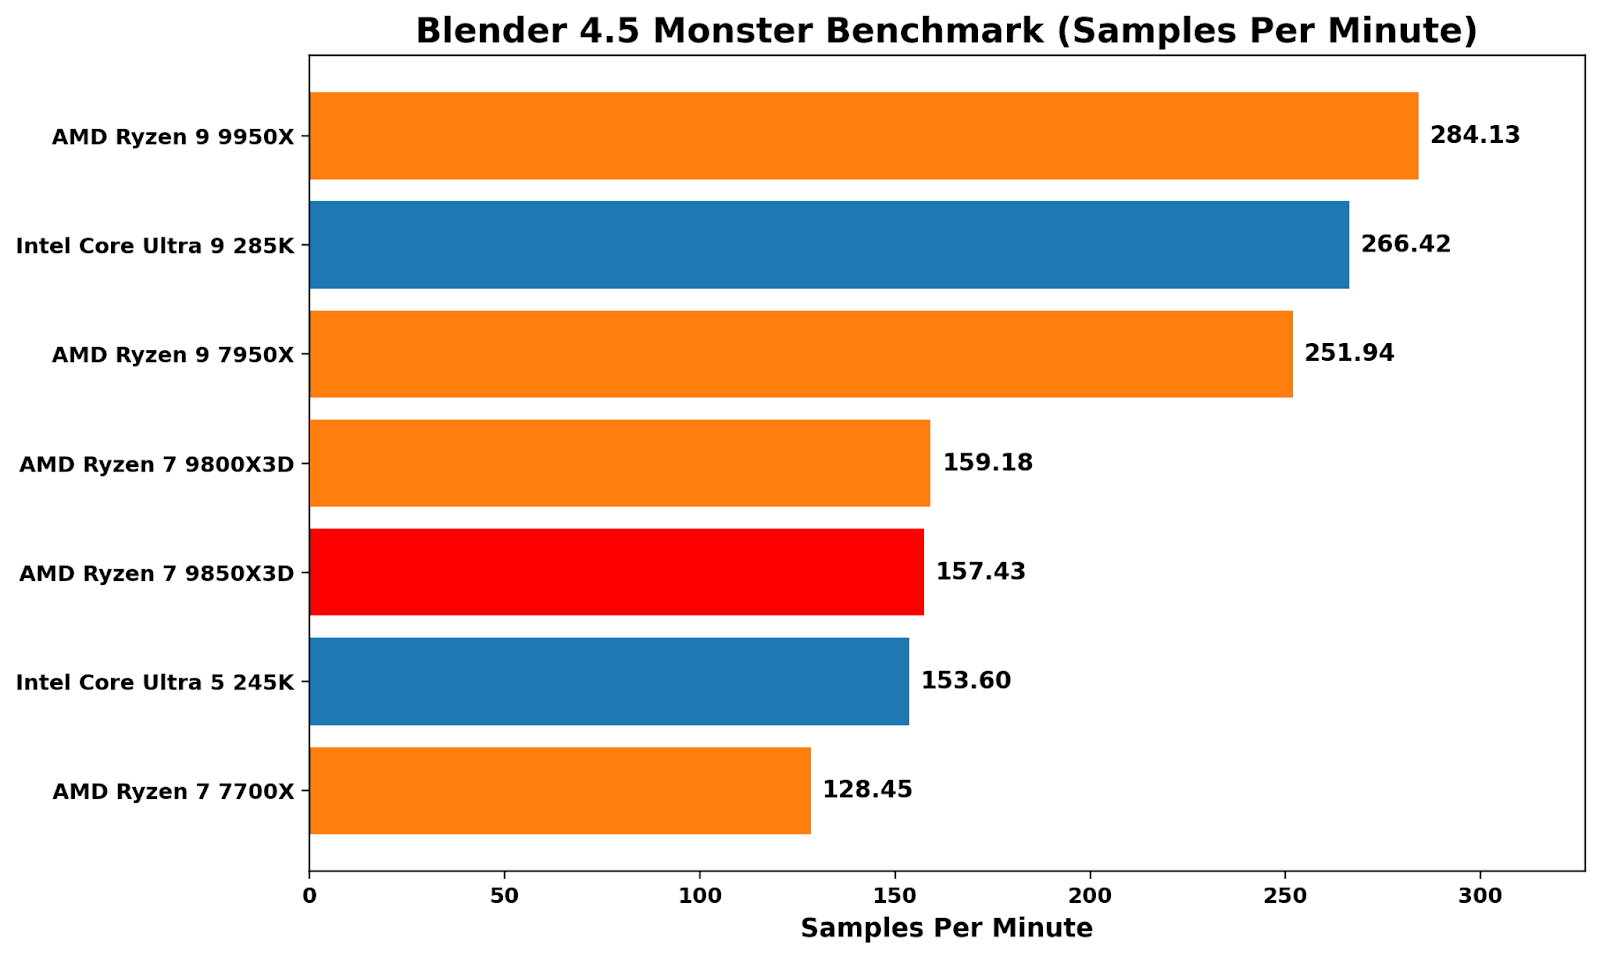
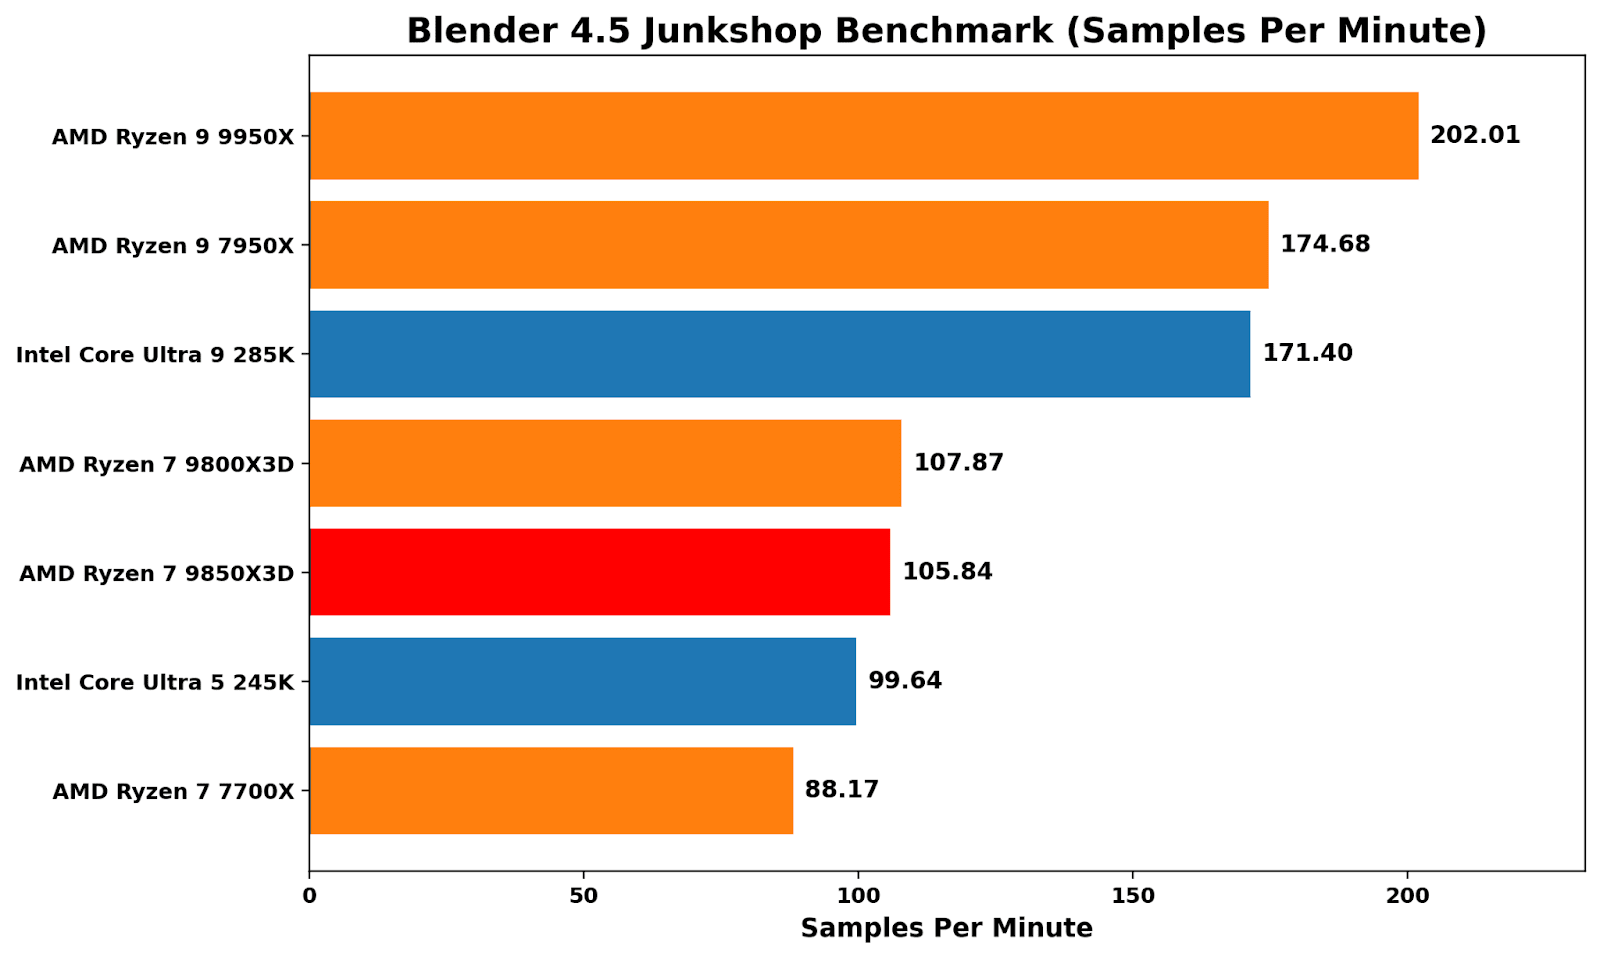
Both Zen 5 X3D chips also perform around the same level as Intel’s Core Ultra 5 245K (14C/14T), which, given Intel’s cheaper MSRP of $309 compare to AMD’s $400-499 pricing of the Ryzen 7 X3D chips, shows Intel offers better value here in rendering throughput.
Discrete Gaming Performance
Then for gaming, we pair the processor with a high-performance graphics card and we have a few select titles and resolutions up for comparisons. Each of our CPUs here is paired with a Sapphire AMD RX 9070 16 GB graphics card.
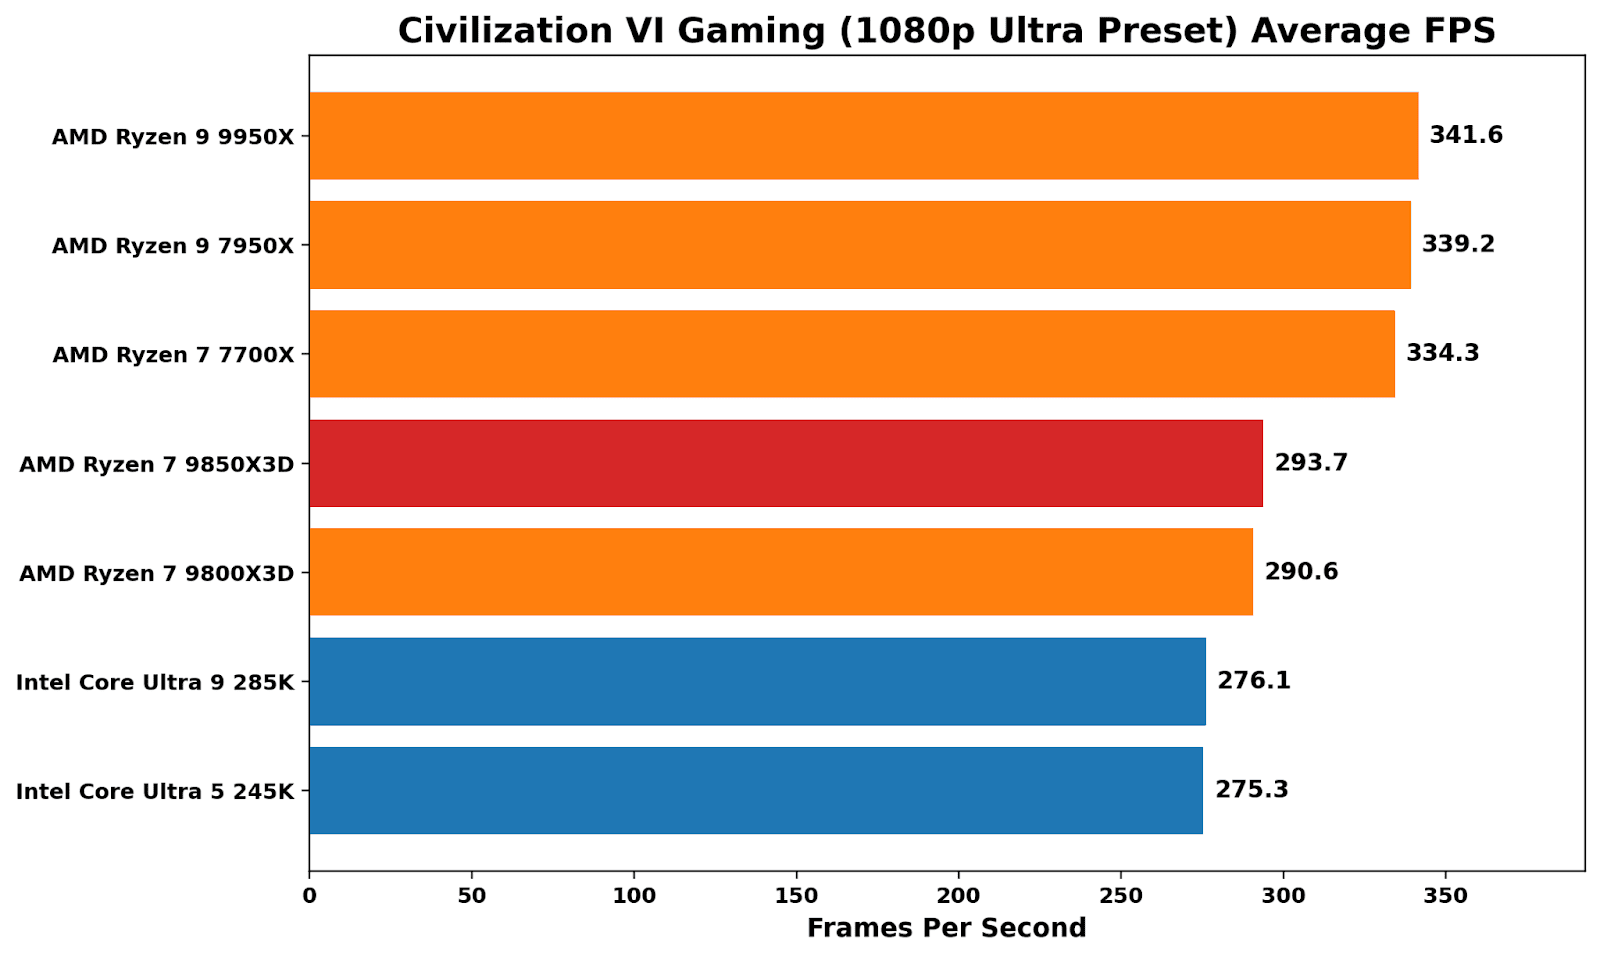
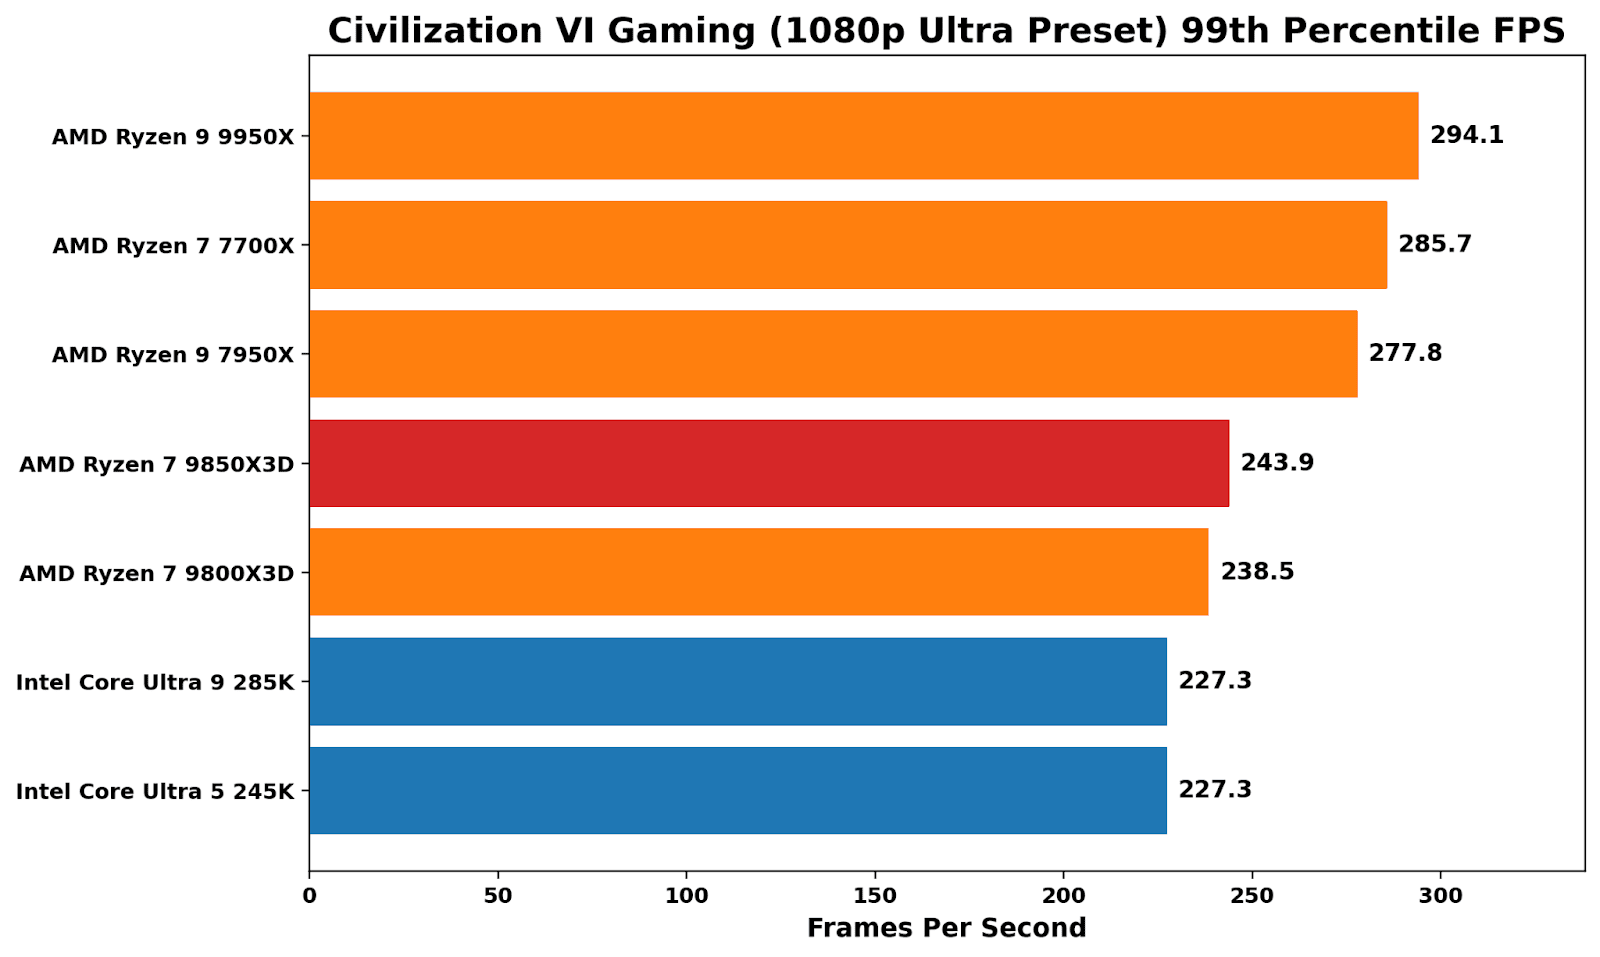
Benchmarking Civilization VI at 1080p Ultra is a good reminder that X3D isn’t an automatic win in all things gaming. The non-X3D Ryzen parts sit at the top, with a noticeable performance advantage over Intel’s Arrow Lake pairing. Comparing the two Ryzen 7 Zen 5-based X3D parts, the 9850X3D is under 1% faster than the 9800X3D. We saw better 99th-percentile performance on the X3D, with the additional frequency giving a small boost on the 9850X3D.
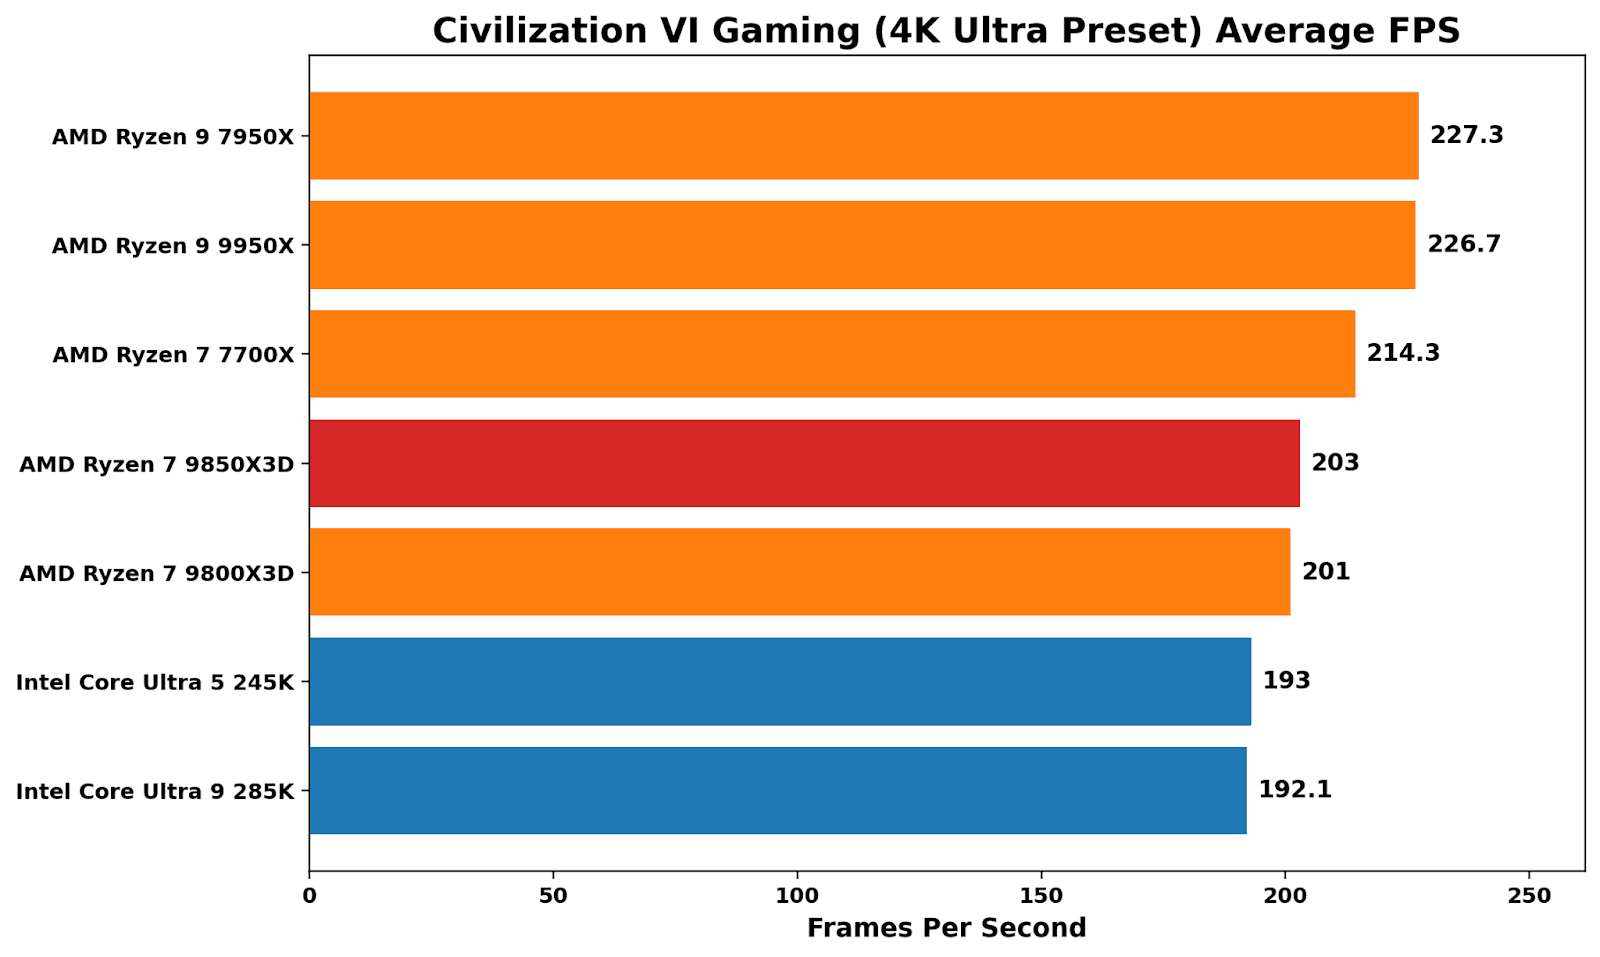
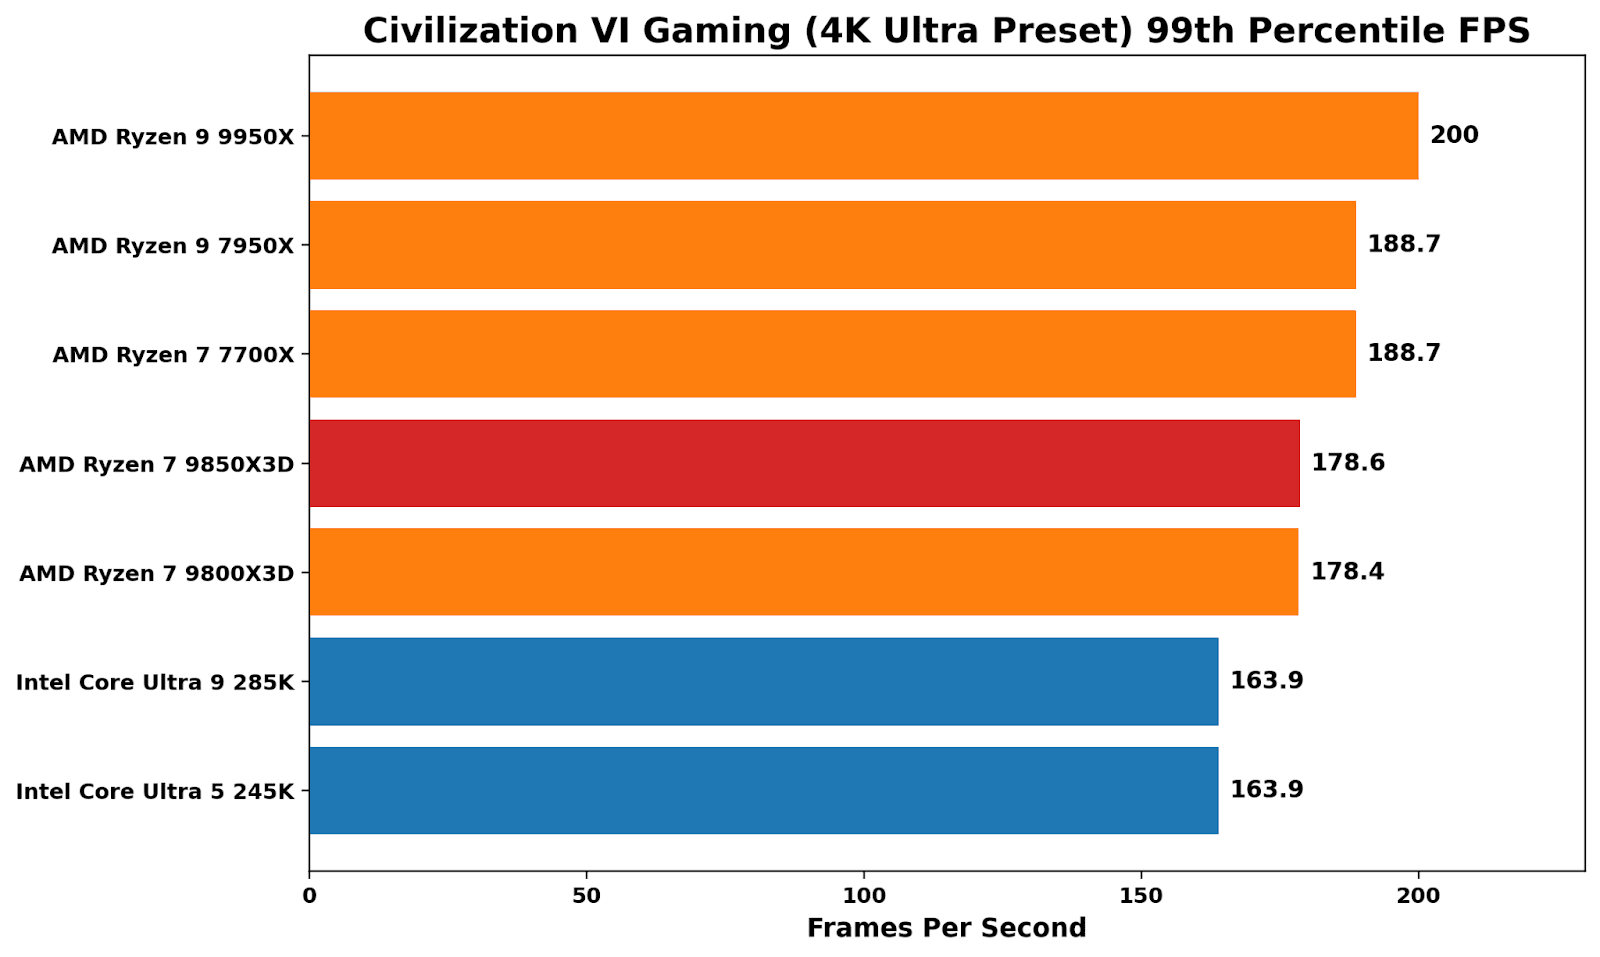
At 4K, where graphical grunt from the graphics card is more important, performance is led by AMD’s 16C/32T offerings, both in average and 99th percentile frames. Both X3D chips perform virtually identically here, while Civ VI is a good indicator of which brand it favors: AMD over Intel.
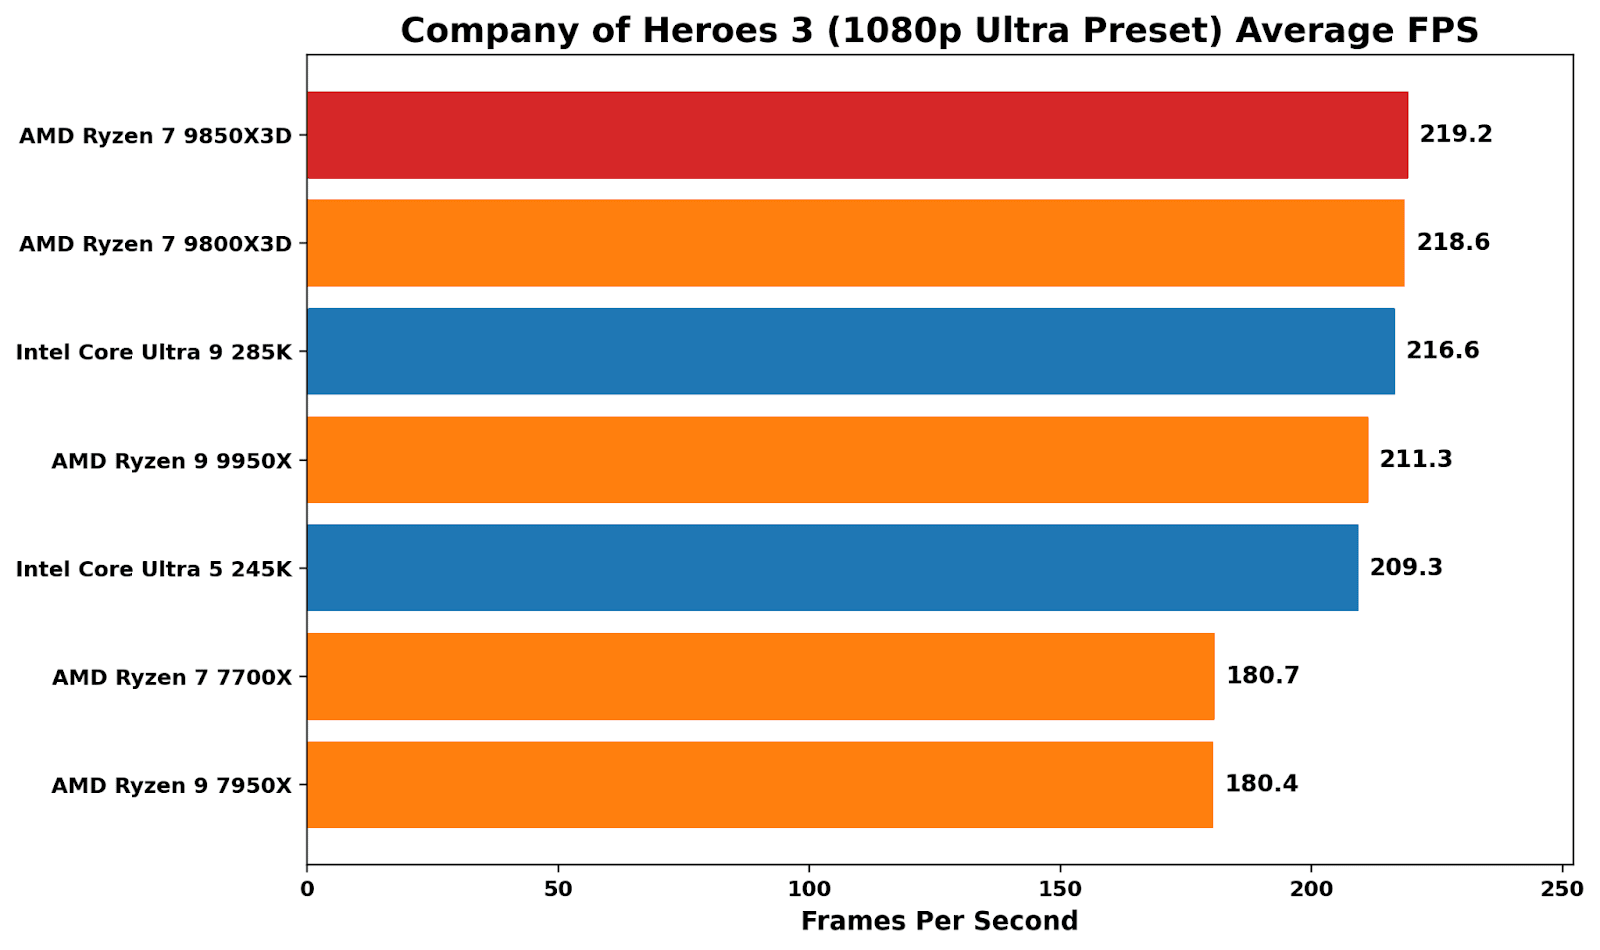
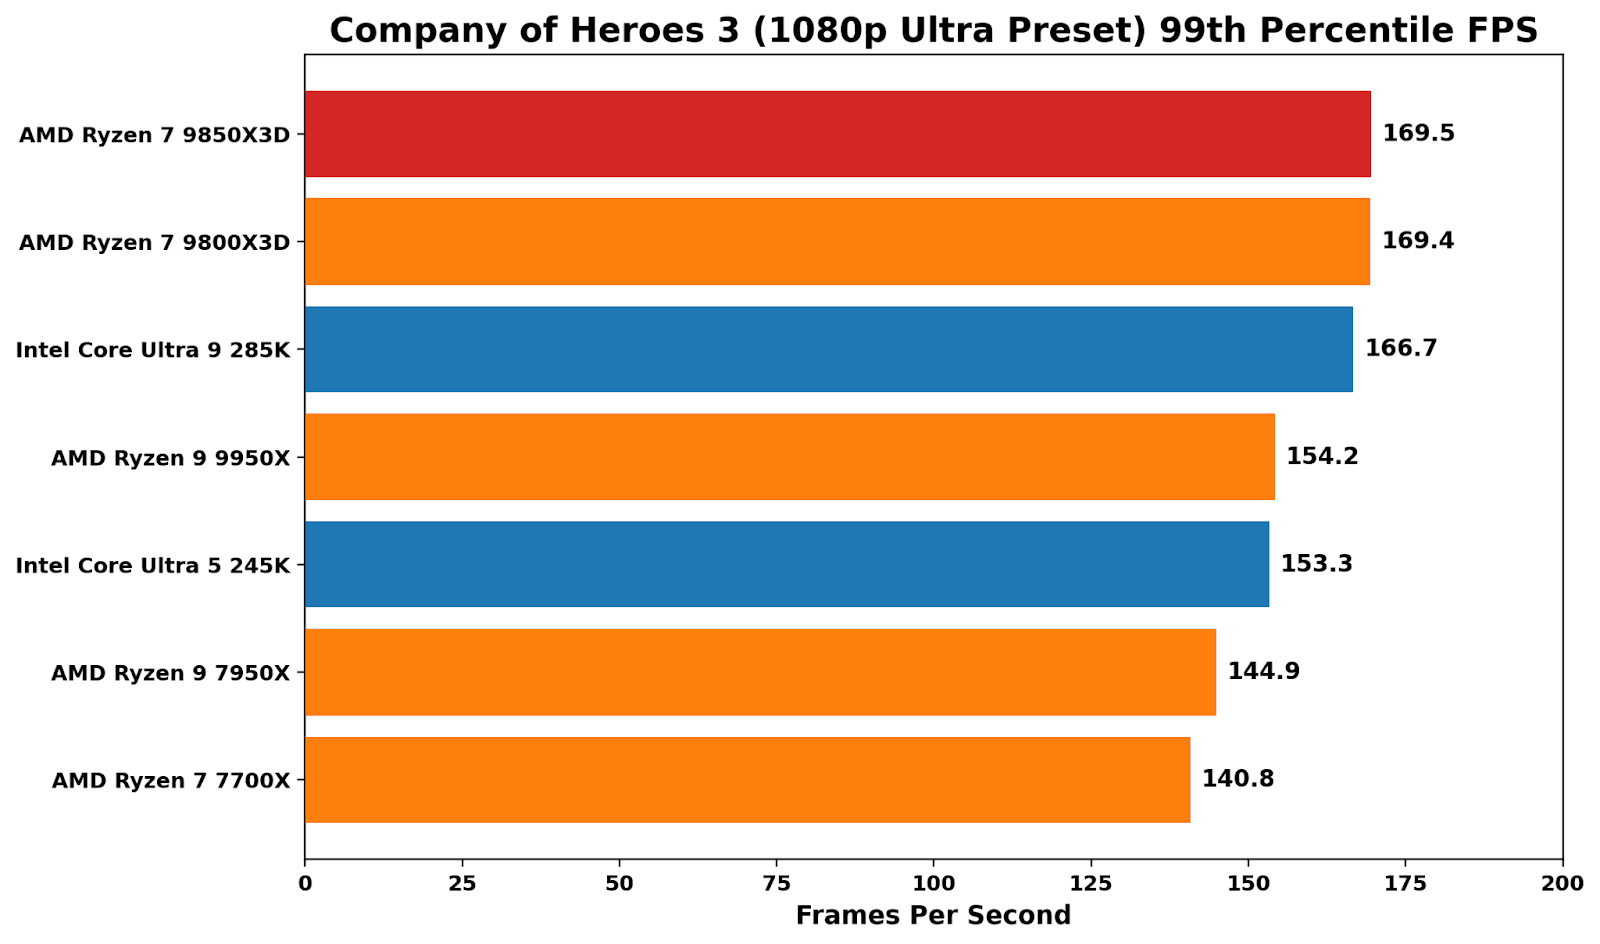
In Company of Heroes 3, the cache-laden X3D chips win out here, although just marginally over Intel’s flagship Core Ultra 9 285K. The difference between the X3D chips is marginal (0.3%), indicating that the extra core speed doesn’t deliver meaningful performance gains here.
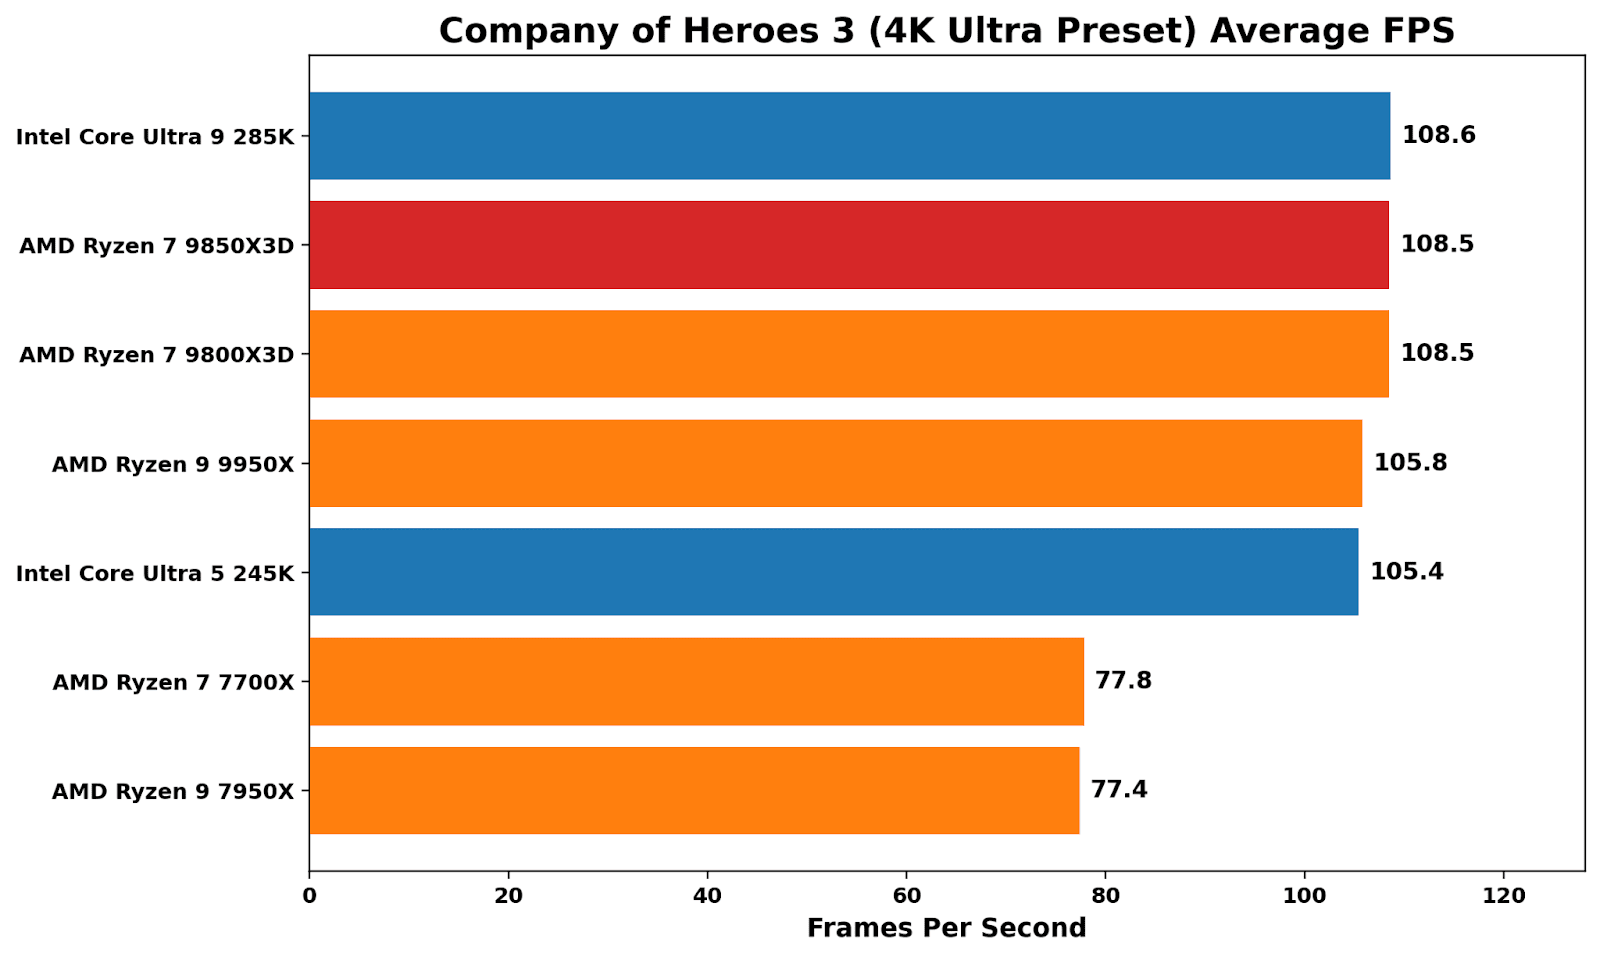
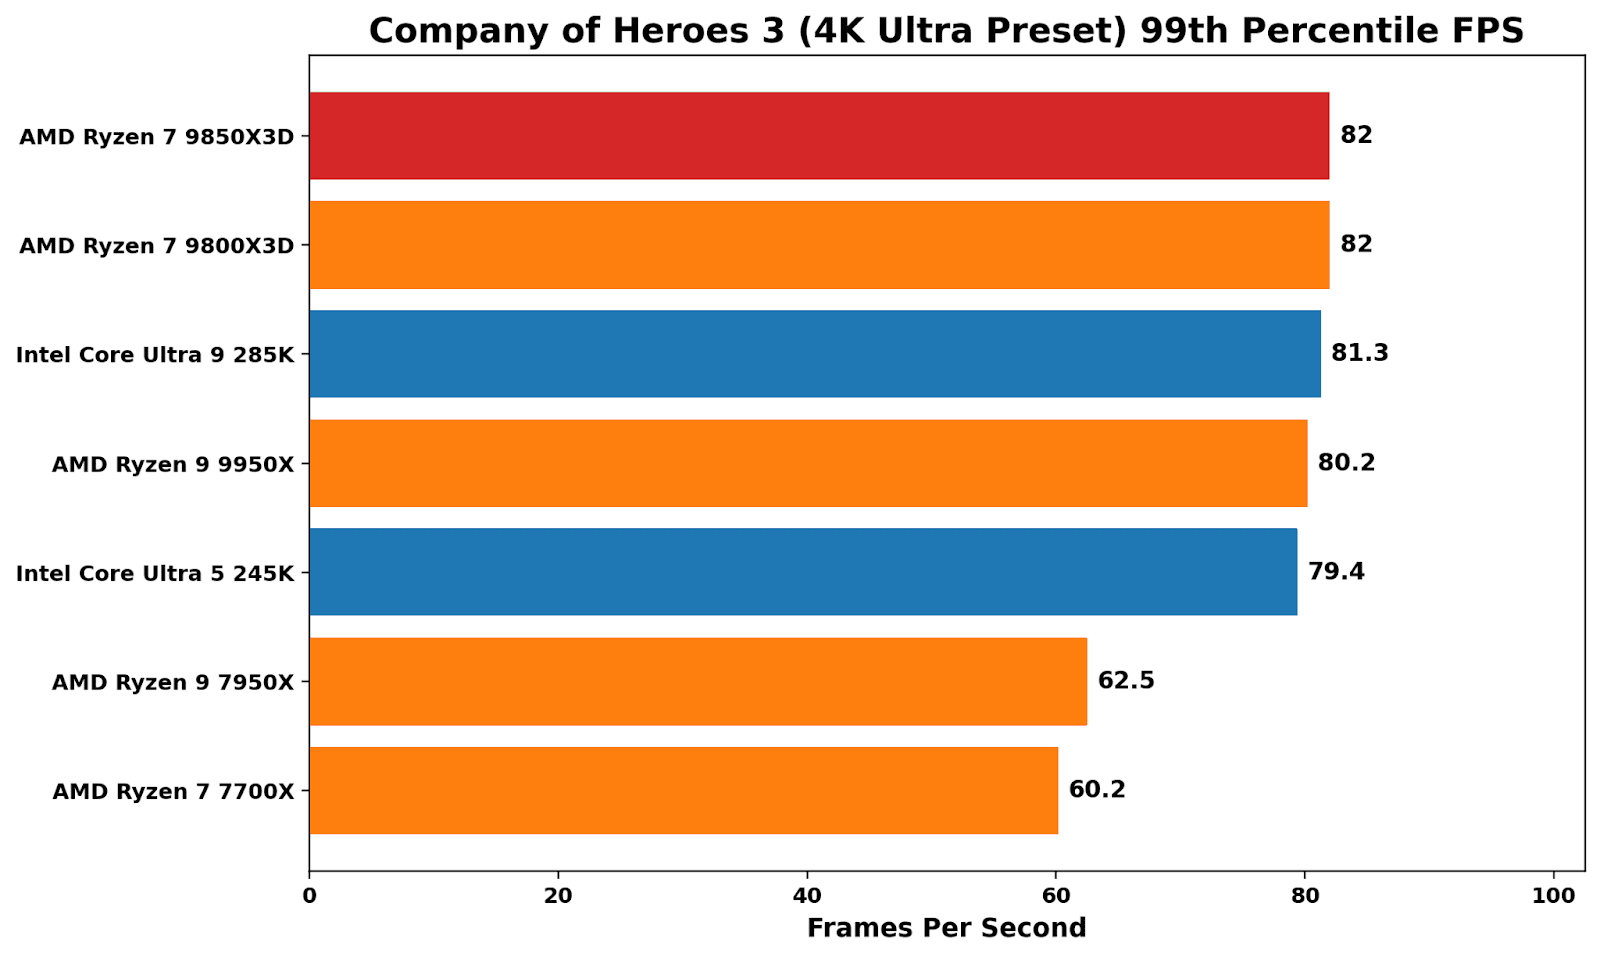
At 4K ultra, Company of Heroes 3 is generally GPU-limited, although there is a noticeable performance uplift from Zen 4 to Zen 5.
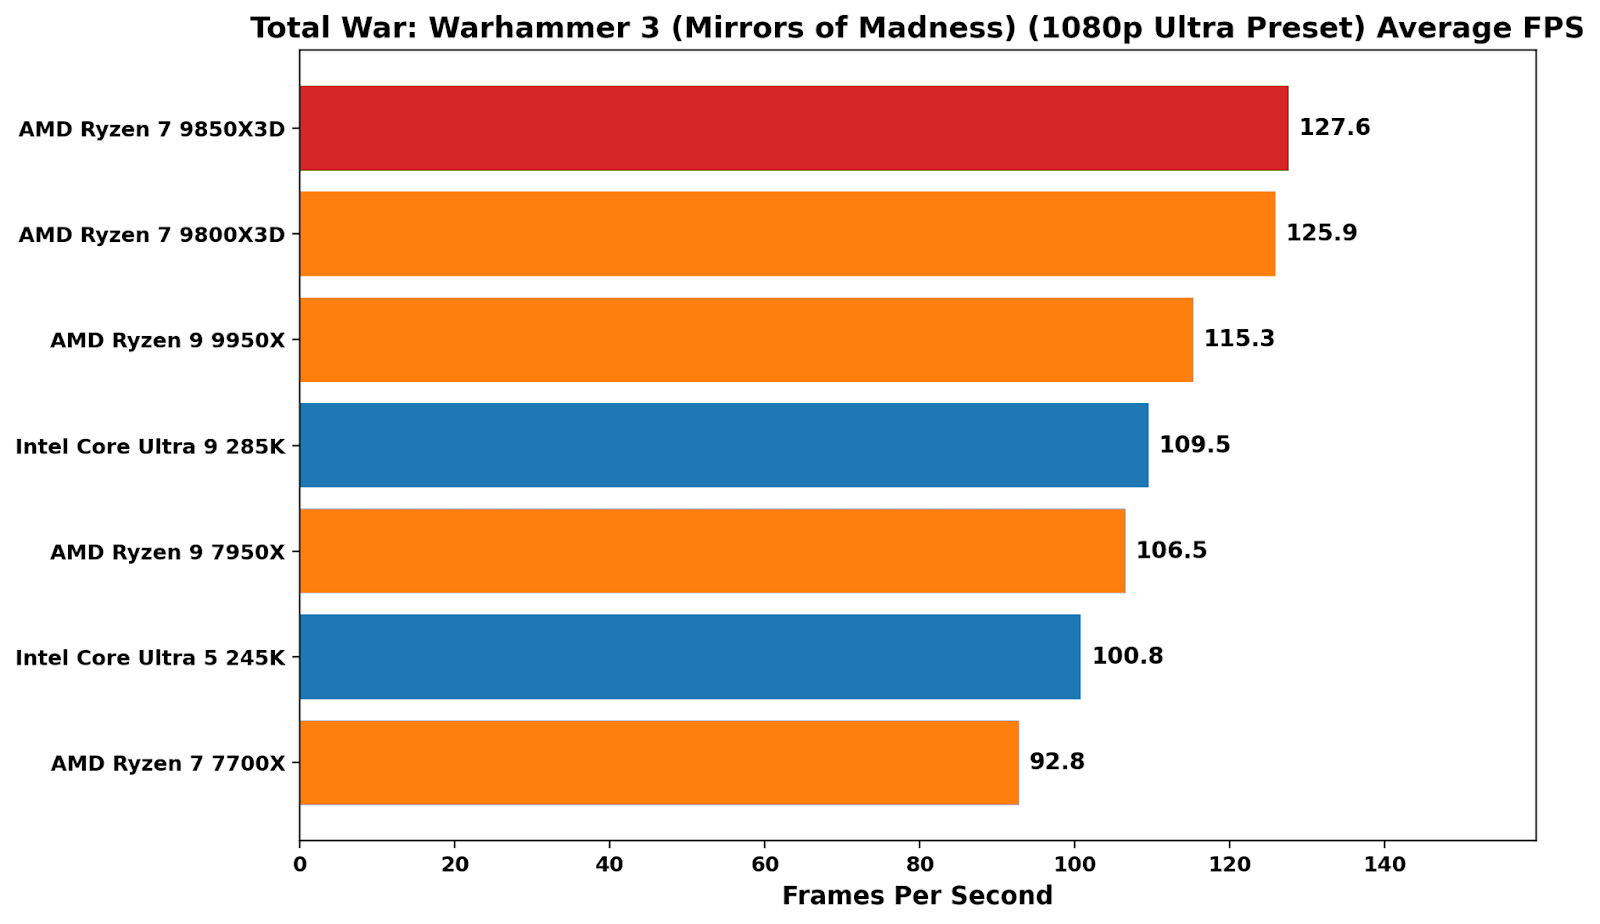
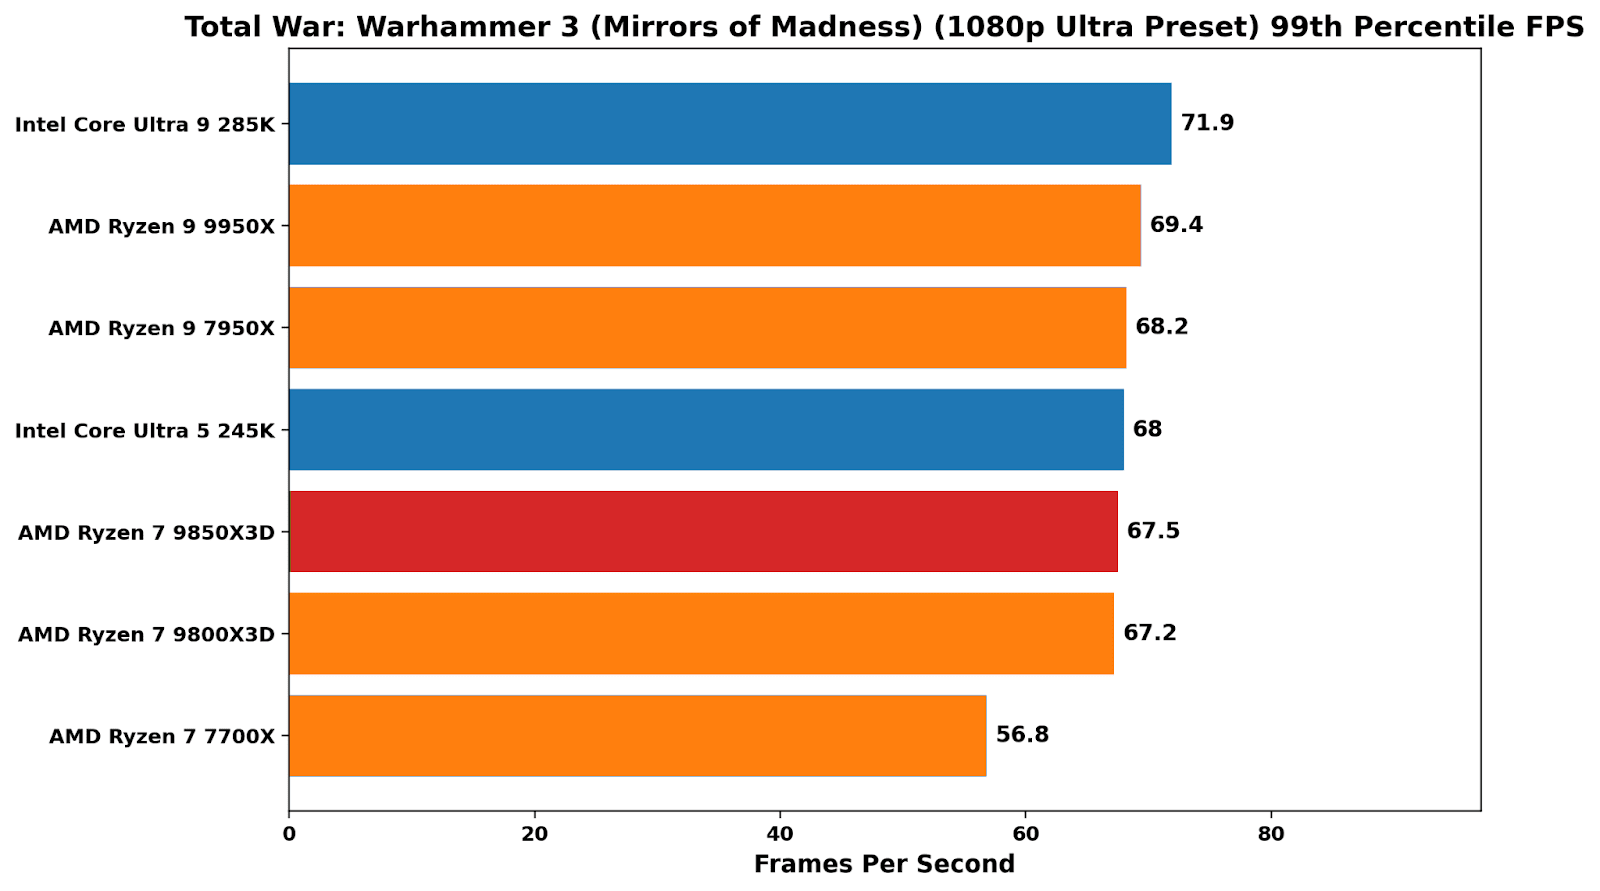
In Total War: Warhammer 3, the X3D peaks again demonstrate their value in kind, with a sprawling, simulation-heavy workload that places heavy cache pressure on the system. At 1080p, both the 9850X3D and 9800X3D sit clearly ahead of the pack, with better average performance than the 9950X and around 15-18% ahead of Intel’s Arrow Lake parts. In 99th percentile performance, things weren’t as peachy as average frame rates, although still up there with the other chips on test (bar the 7700X, which lags behind pretty much consistently in overall performance).
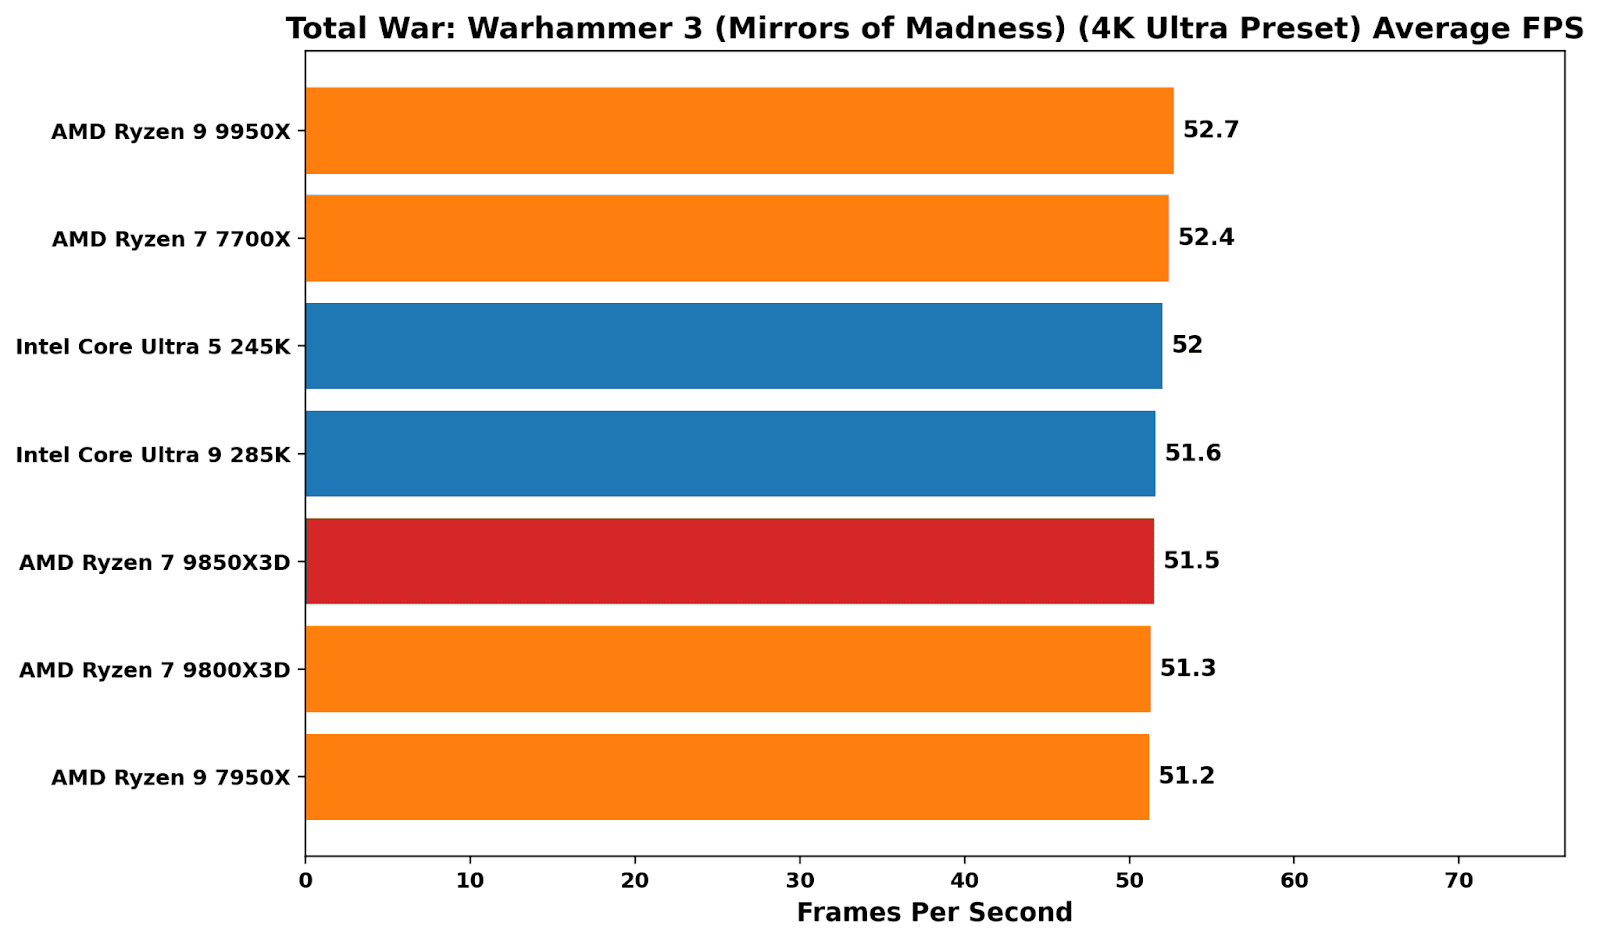
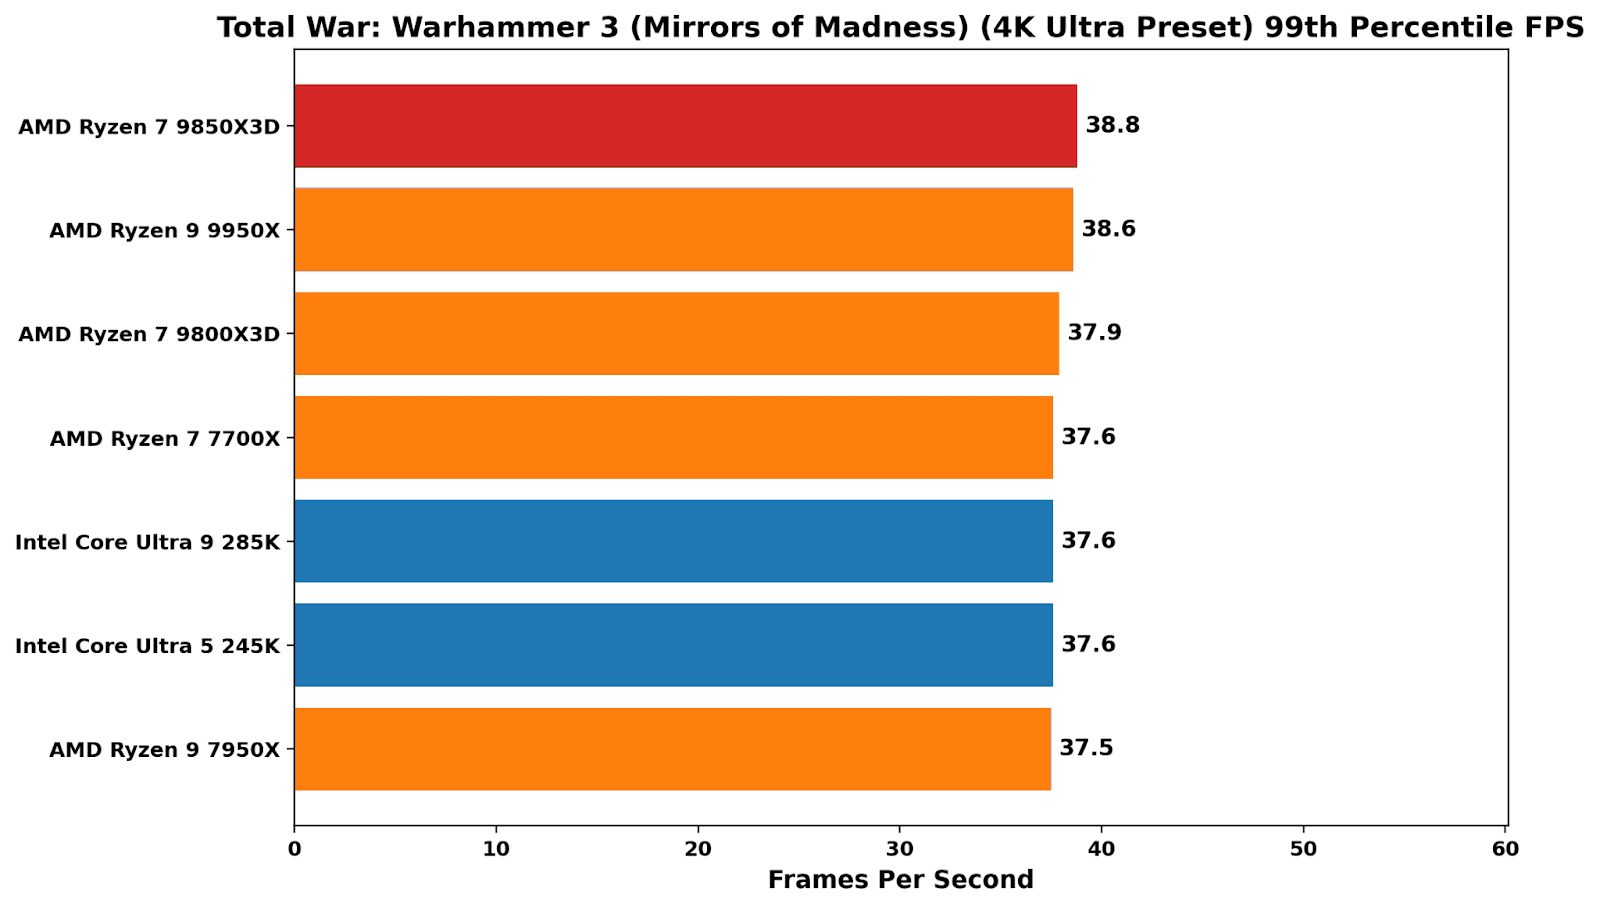
At 4K, there’s literally no difference among the chips in testing, which is typical for a GPU-bound scenario at higher resolutions.
Price vs Performance
The 9850X3D is the simplest kind of CPU refresh on paper: it has the same 8-core Zen 5 X3D layout as the 9800X3D, the same cache stack, and the same AM5 platform, but is binned to hit a higher boost target on the core frequency. That makes it a good opportunity to not entirely ignore headline clocks, but to place greater emphasis on the behaviour when running workloads, and to look at what actually changes in practice.
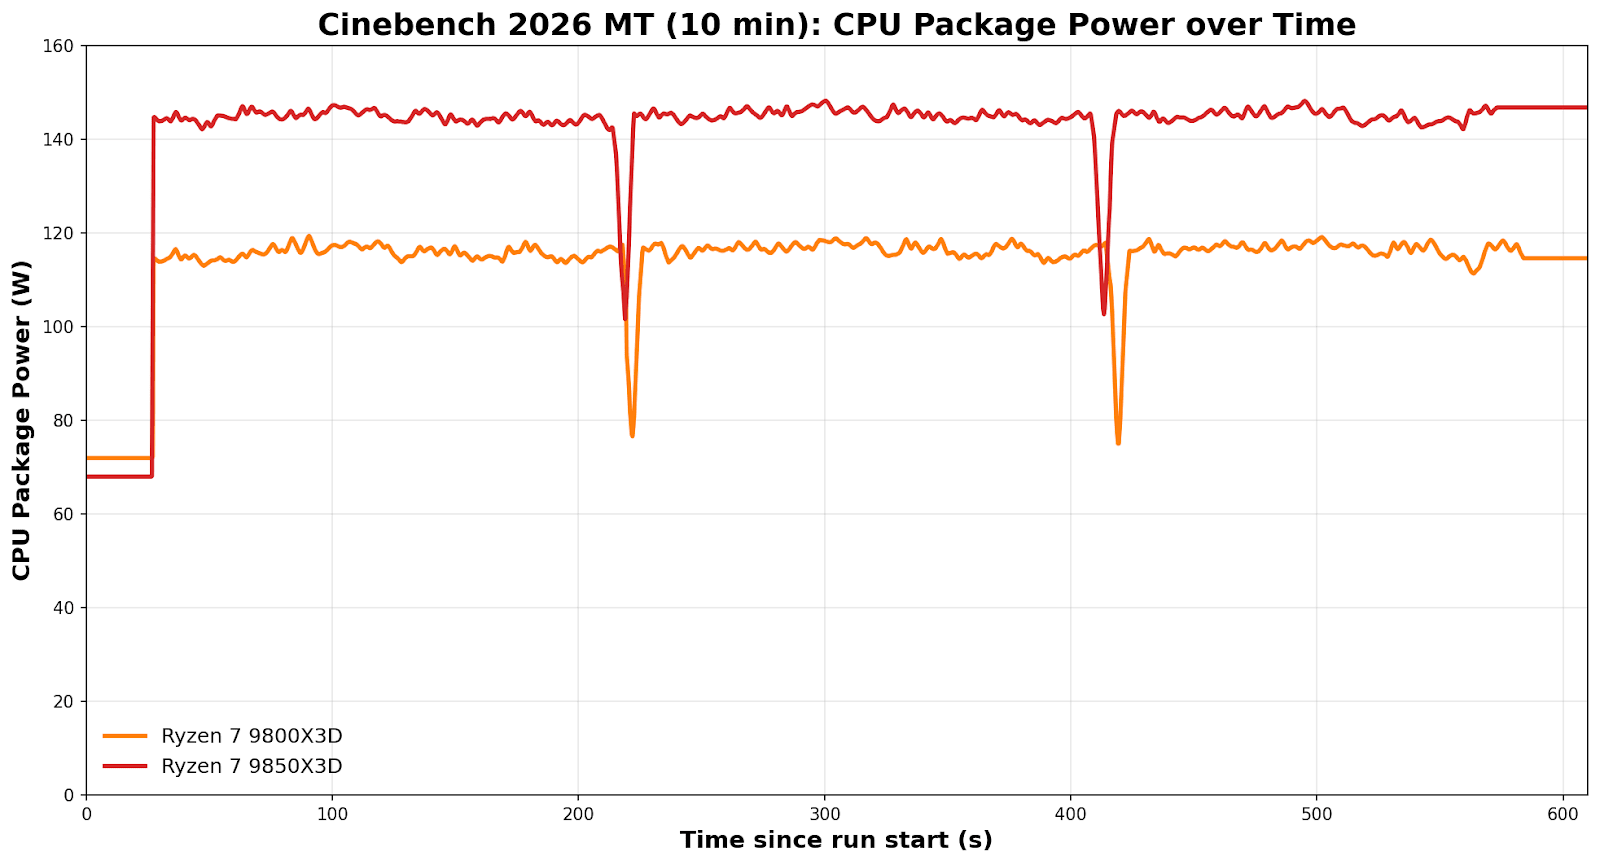
My aim here is to show how the chips behave under sustained load, what voltage and power it takes to maintain the all-core frequency, and whether the extra performance is efficient or just expensive. Using matched 10-minute Cinebench 2026 multi-thread runs, the charts below focus on the deltas between the 9850X3D and 9800X3D in power, Vcore, clocks, and temperature, and what that means for performance-per-watt.
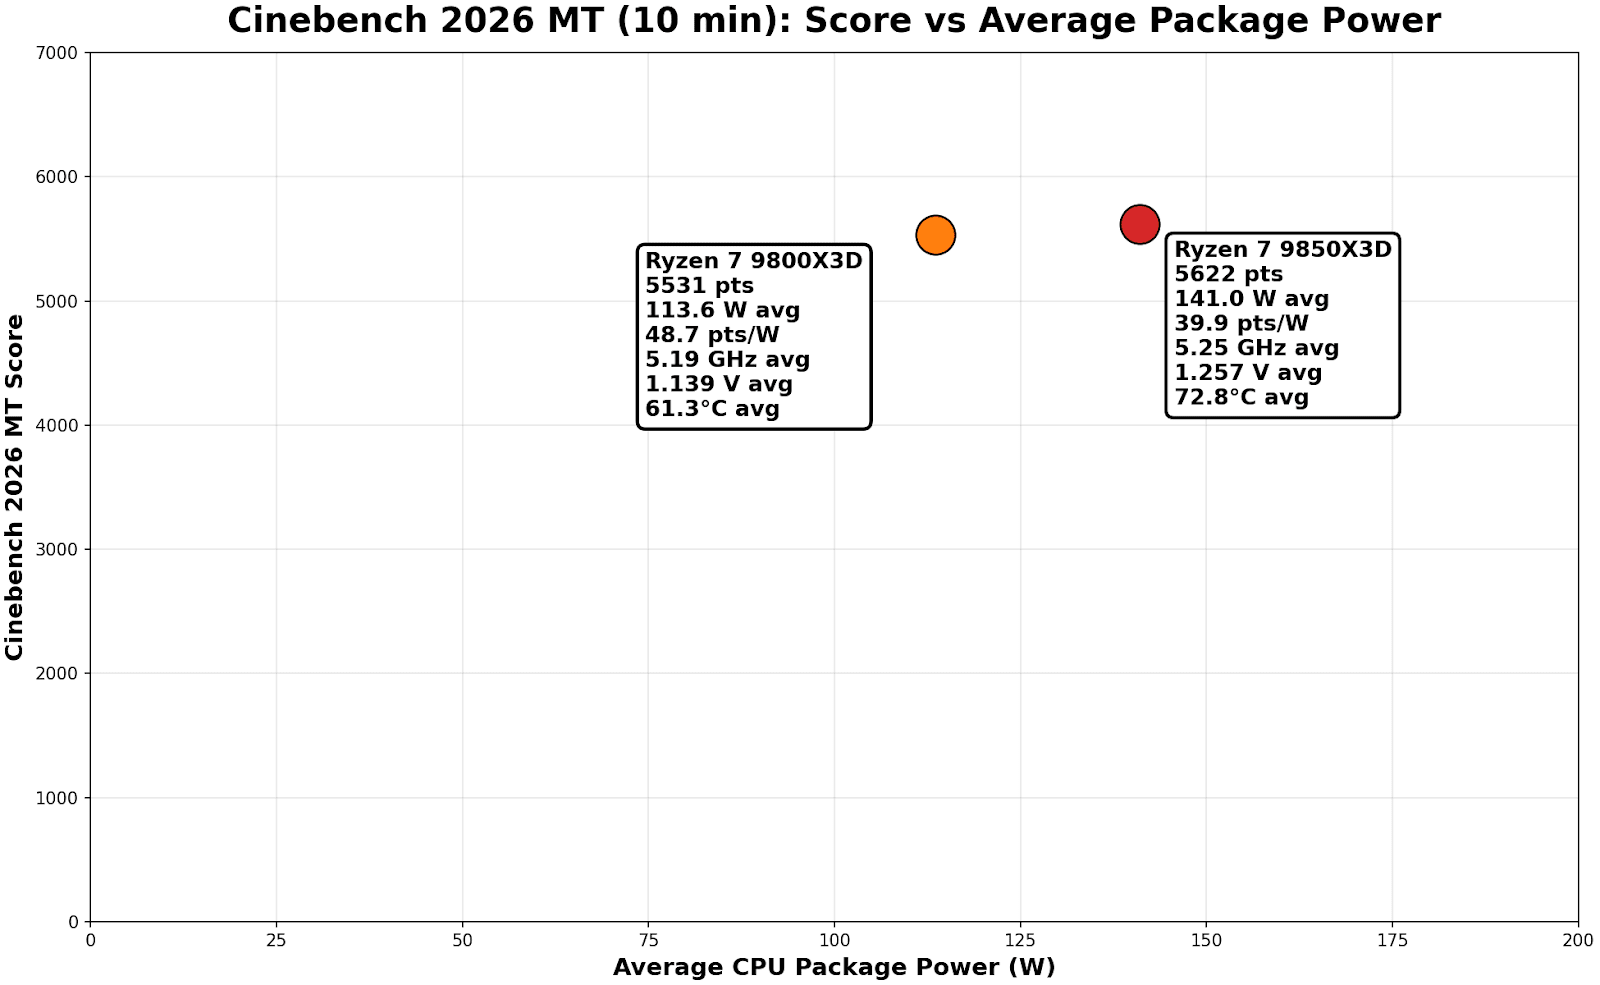
On the Score vs average package power plot, the story is quite brutally simple: the 9850X3D is buying a tiny score bump with a pretty big watt increase to achieve it.
-
9800X3D: 5531 pts at 113.6 W avg
-
9850X3D: 5622 pts at 141.0 W avg
This means the Ryzen 7 9850X3D achieves a ~1.0% performance uplift in exchange for operating at 24.1% higher power. If you want a single “efficiency” figure from that chart, points per watt show the following:
-
9800X3D: 48.7 pts/W
-
9850X3D: 39.9 pts/W
Now this looks somewhat absurd on the face of it. But the reality is, even within these chips, we don’t know if we have a ‘good version’ of one and a ‘bad version’ of the other. It’s something other testers are also seeing – some have larger power differences, others have next to zero. But on this data alone, it would imply that the Ryzen 7 9850X3D is around 18% less efficient in Cinebench 2026 MT under a sustained CPU-only, non-cache heavy workload. The behavior that differentiates the chips is exactly what we would expect to see from a higher-binned SKU under an all-core load.
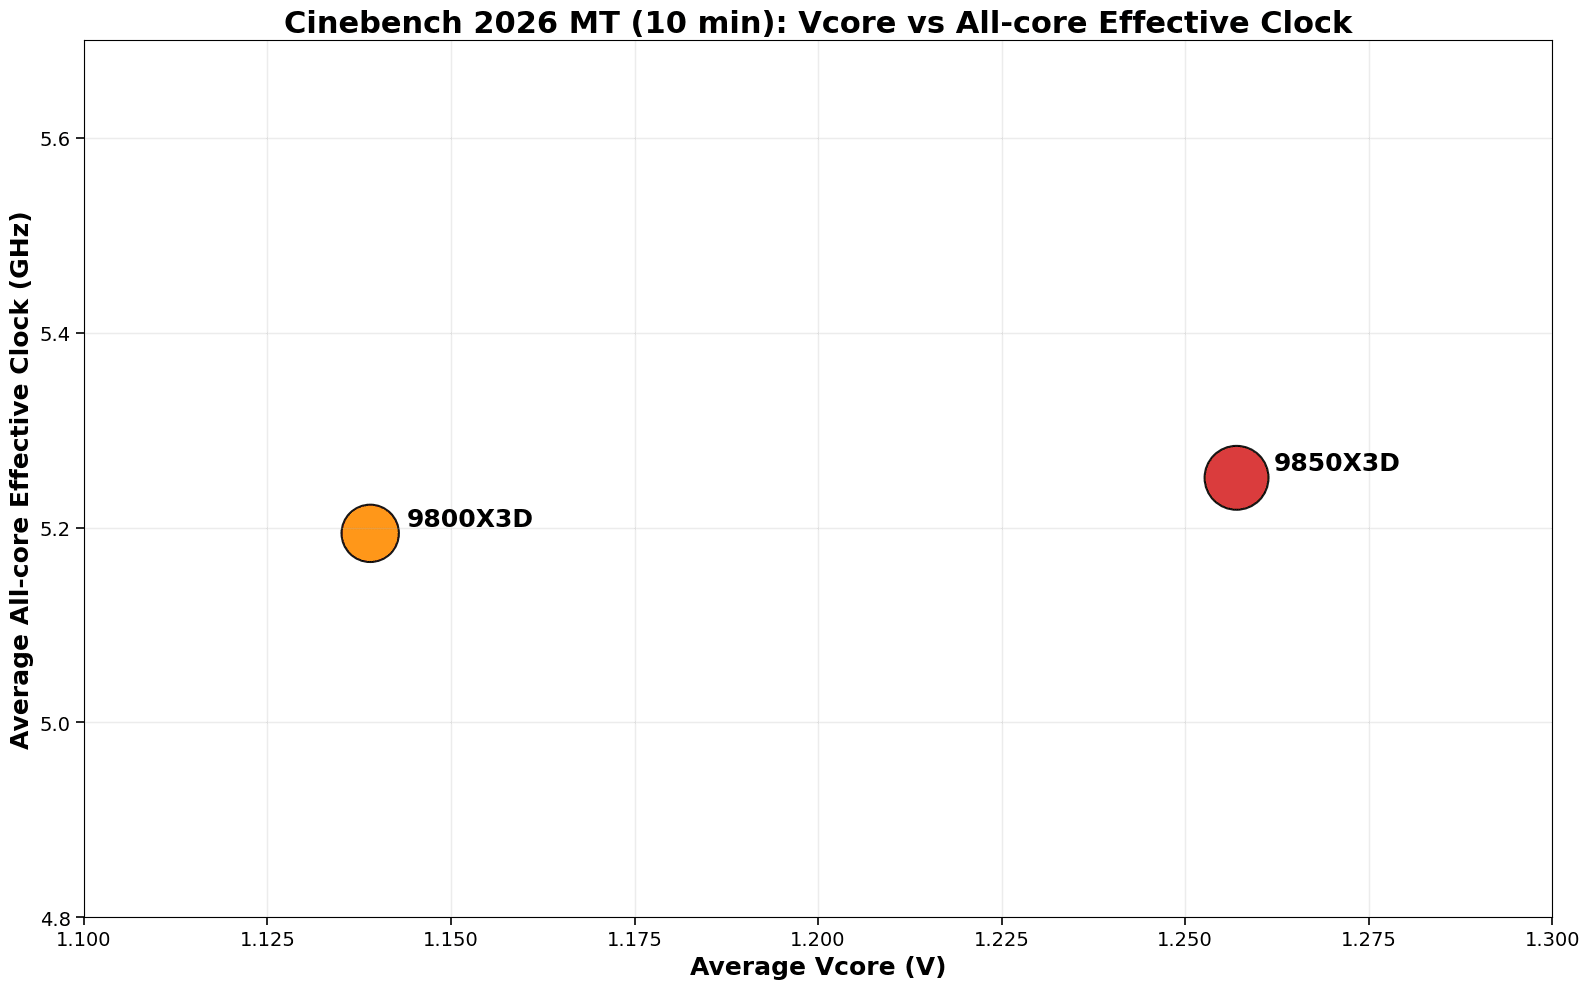
The 9850X3D runs at a faster all-core frequency of 5.25 GHz, compared with the 9800X3D at 5.19 GHz, a 1.1% increase. This is at a cost of a higher V-core curve, which we observed at 1.257 V on average, a large 10.4% bump over the 9800X3D at 1.139 V.
Operating at a higher CPU VCore effectively means two things: it draws more power at the package level and runs hotter. The extra 27.4 W drawn by the higher-binned 9850X3D yields only an additional 91 points in Cinebench 2026 MT, at the cost of running around 11°C hotter.
That’s for a CPU-only workload, but what about during gaming?
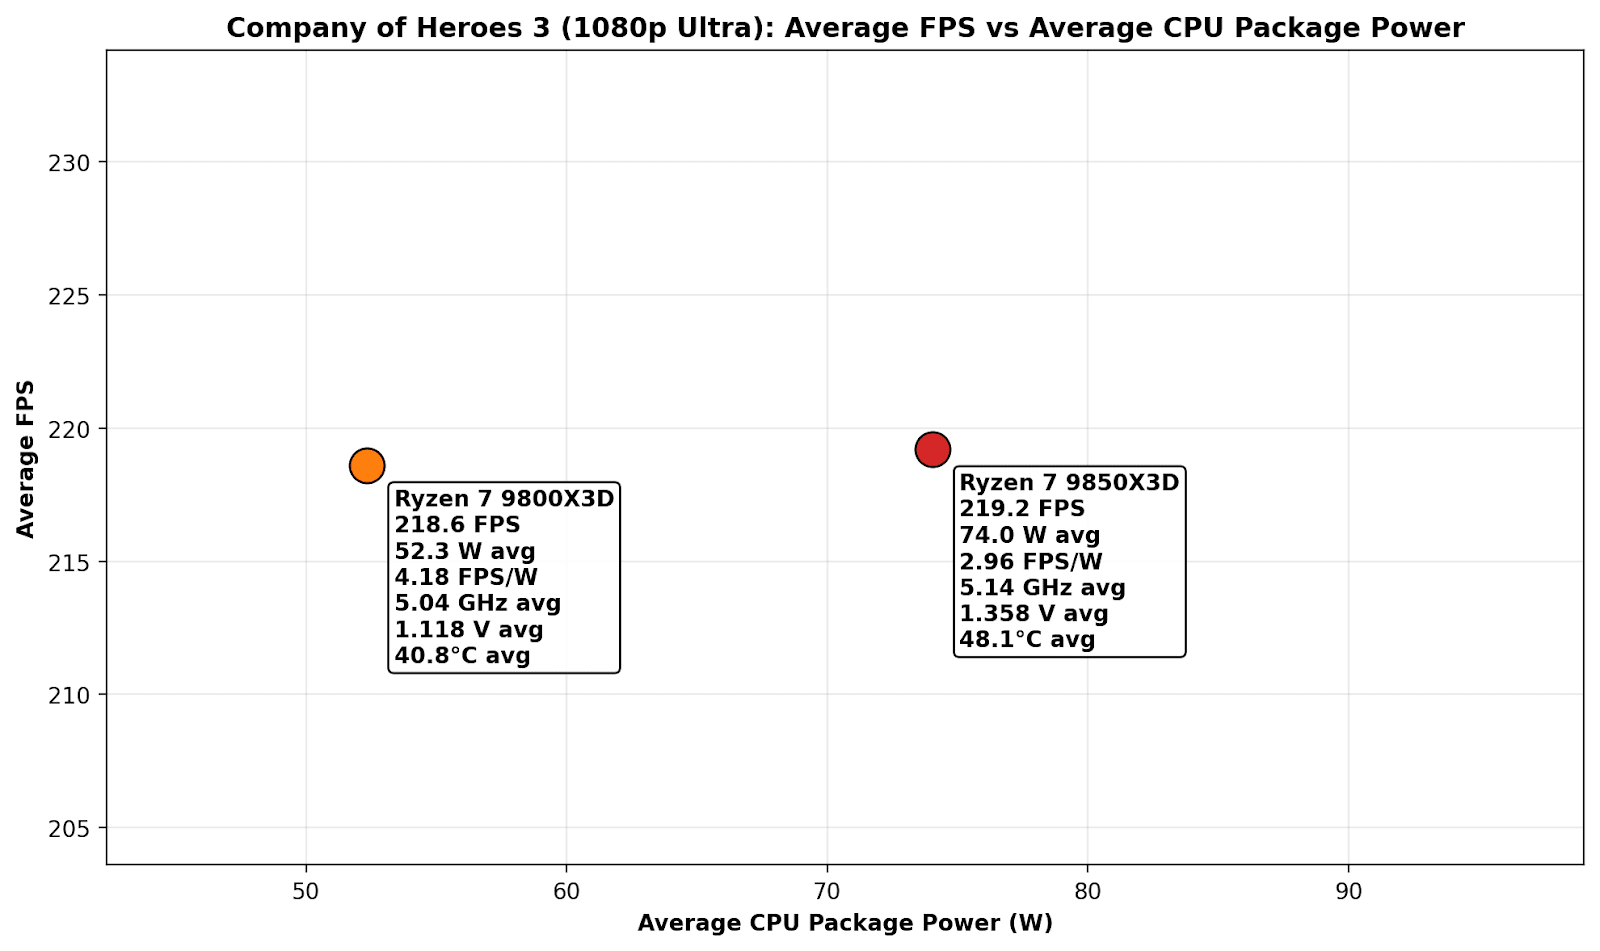
In the above plot chart, there’s no real difference in average frame rate performance between the two at 1080p ultra settings in the Company of Heroes 3 benchmark. We do however, observe that to achieve parity in average framerates, the 9850X3D is pulling a whopping 74 W on average, which equates to 2.96 FPS per watt; but the 9800X3D is 41% more efficient with 4.18 FPS per watt, with an average package power draw of 52.3 W. Compared to multi-threaded workloads, gaming isn’t as intensive on the cores, so temperatures are both below 50°C here, but the 9800X3D not only runs around 8°C cooler, it averages a much lower CPU V-Core and is 42% more power efficient to achieve virtually identical frame rates.
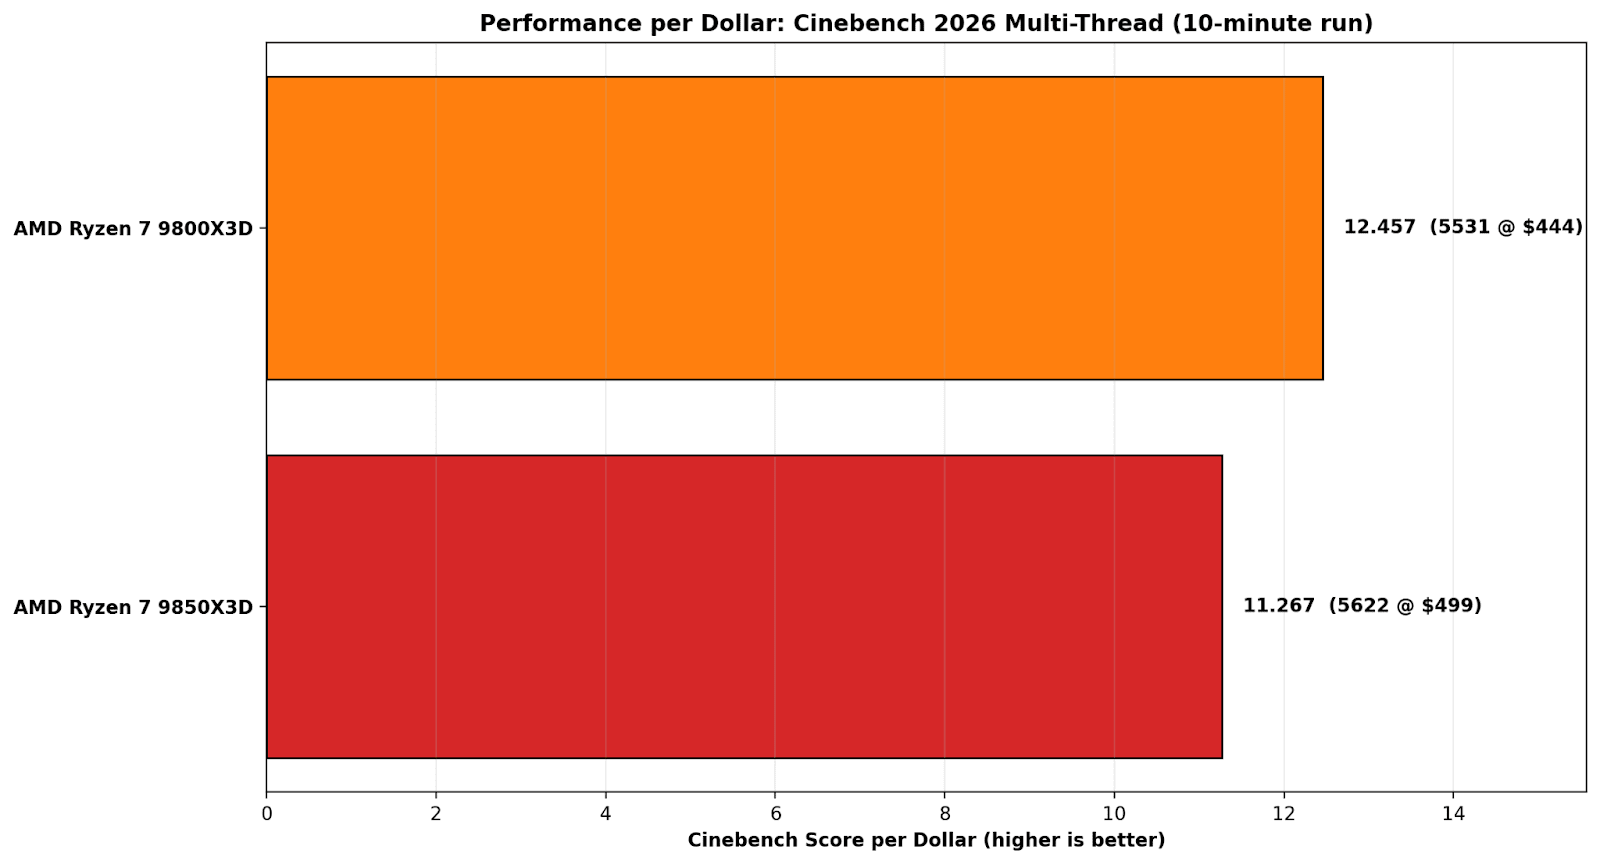
On Cinebench 2026 multi-thread performance per dollar, the 9800X3D is simply the better buy. Its 5531-point score at $444 works out to 12.457 points per dollar, while the 9850X3D’s 5622 points at $499 drops to 11.267 points per dollar. Put another way, the 9800X3D delivers about a 10.6% value advantage, which makes the 9850X3D’s small score gain hard to justify once the price increase is factored in.

On Company of Heroes 3 at 1080p Ultra, the performance-per-dollar picture is even more one-sided because the actual FPS result is basically a tie. The 9800X3D posts 218.6 FPS at $444, which works out to 0.492 FPS per dollar, while the 9850X3D manages 219.2 FPS at $499, or 0.439 FPS per dollar. That tiny 0.6 FPS advantage doesn’t come close to justifying the price bump, which leaves the 9800X3D at roughly a 12% better value in this specific game test.
Overall, the Ryzen 7 9800X3D is a considerably better value proposition than the 9850X3D right now; that extra $45-55 in savings could be put towards memory. The DRAM market is turbulent at the moment, affecting all desktop platforms. Right now, DRAM is being tugged in two directions. Demand for AI infrastructure is causing the companies that need it to bid directly on supply, pushing up the price. That has a direct effect on the overall cost of building a new PC, so opting for better performance per watt and performance per $ is crucial to delivering value to consumers.
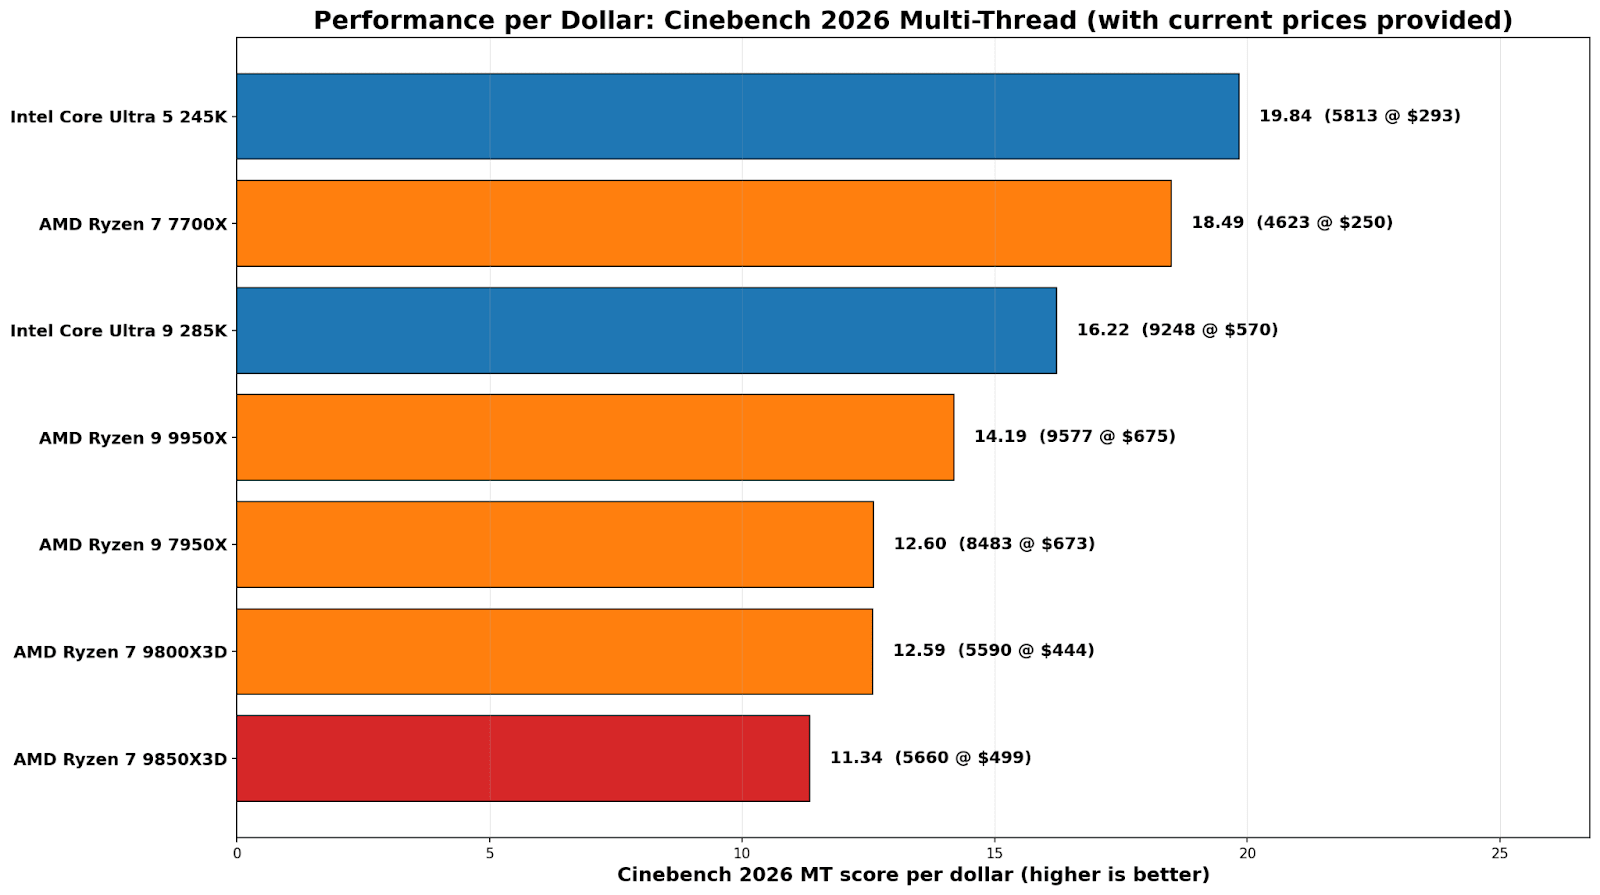
On a straight score-per-dollar basis, the Core Ultra 5 245K is the value standout here at 19.84 points per dollar (5813 for $293). The Ryzen 7 7700X isn’t far behind at 18.49 (4623 for $250). From there, it drops off pretty quickly once you climb into the high end, where you’re paying a lot more for smaller gains. The Core Ultra 9 285K comes in at 16.22, while the Ryzen 9 9950X lands at 14.19.
The most relevant comparison in this section is between the two 8-core X3D parts. The 9800X3D works out at 12.59 (5590 for $444), and the 9850X3D slips to 11.34 (5660 for $499). Same takeaway as the efficiency charts: you’re paying extra for a marginal bump, and on multi-threaded performance per dollar, the 9850X3D is simply the weaker buy right now.
For users looking for the best CPU grunt for their money, Intel’s Core Ultra 245K is the best buy, while the 9800X3D is the best value pick for gamers, especially for CPU-bound games at lower resolutions. The last-generation Ryzen 7 7700X, based on Zen 4, is also a solid pick for compute tasks, though our gaming results place it well below the other chips tested.
DDR5 pricing has been a top topic lately, making selecting DRAM one of the most annoying parts of budgeting a desktop build. One week, a sensible 32GB kit looks fine; the next, it has jumped just enough to make you stop, double-check, and start that mental shuffle of where the money should actually be spent. The problem is, users need DRAM to make a system work, and for new builders, there’s no way to avoid the market volatility, which can completely change the whole conversation about value.
Conclusions
Across the compute and gaming results, the Ryzen 7 9850X3D is only fractionally ahead of the 9800X3D, roughly half a percent in compute and about two-thirds of a percent in gaming overall. The wins are real in a couple of single-threaded tests, but they do not translate into a consistent uplift in heavier rendering or real-world gaming at higher resolutions. The awkward bit that we have to unfortunately focus on is power: peak draw rises from 119 W to 131 W, so you are spending about 10% more power to buy roughly 1% performance, and the efficiency maths just does not work in the 9850X3D’s favour. It feels as if the Ryzen 7 9850X3D is a flex on binning rather than an upgrade over the 9800X3D, despite the 400 MHz boost to 5.6 GHz; the 9800X3D tops out at 5.2 GHz.
It’s also worth being very clear about what X3D is doing here, too, in terms of performance. The cache still helps where it has in the past, with CPU-bound games seeing an elevated boost in both average and 99th-percentile frame rates. In compute-heavy applications such as rendering, there’s no noticeable difference between having a 3D V-Cache and not having one; it doesn’t affect performance here.
The practical conclusion is a simple one: the AMD Ryzen 7 9850X3D is not a bad chip; it’s just not meaningfully better than the 9800X3D. Unless the price is a sticking point, get whichever chip is cheaper if you’re a gamer, although if you need more compute heavy grunt in a processor, the Intel Core Ultra 9 285K and Ryzen 9 9950X offer much more in multi-threaded performance.